Record-Breaking 90-Day Bitcoin Rally Shows Bull Market Characteristics: Latest Research
Following a drop beneath $60,000, Bitcoin experienced a 90-day rally that set a new record as the most extended upward trend during a bear market phase in the cryptocurrency's history.

New analysis suggests Bitcoin (BTC) has maintained an upward trajectory for 90 consecutive days and displays characteristics of a "bull market rally."
Key points:
- Bitcoin has sustained an upward trend for 90 consecutive days during its bear market phase — an unprecedented occurrence.
- Analysts therefore characterize the price action as resembling a "bull market rally," with the macro lows from February remaining intact.
- Additional analysis suggests bulls need to recapture the weekly supertrend level closer to $90,000 to validate their return to dominance.
Unprecedented bear-market uptrend in Bitcoin's history
In an X post published Thursday, analyst and trader Matthew Hyland noted that Bitcoin's latest recovery from macro bottom levels has been historically unique compared to previous rebounds.
"This BTC rally resembles a bull market rally NOT a bear market rally," he summarized.
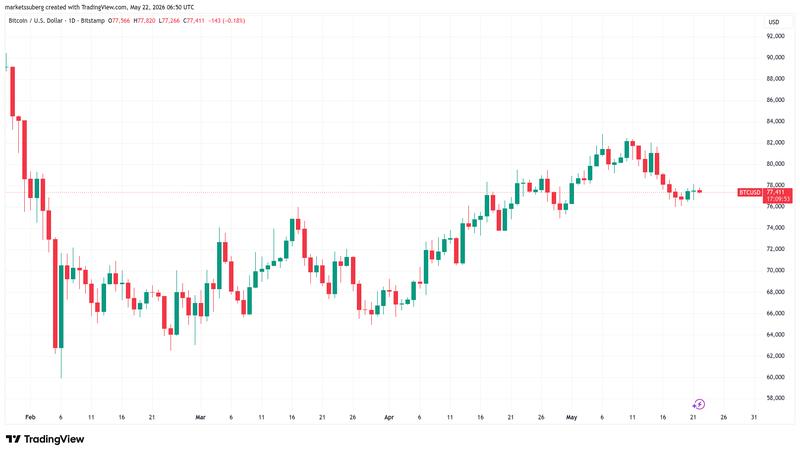
Based on Hyland's assessment, BTC/USD entered a new uptrend beginning in February's final week. The pair experienced a brief dip below $60,000 at the beginning of that month, marking its weakest performance since the latter part of 2024.
Following that low point, a recovery phase emerged, with Bitcoin climbing to local peaks approaching $83,000 precisely three months following the February trough, according to data provided by TradingView.
"There has NEVER been a rally that trended upward for 89 days ever in a bear market in BTC history," he continued.
"The break of high time frame resistance also has marked the start of a bull market rally the prior three times."
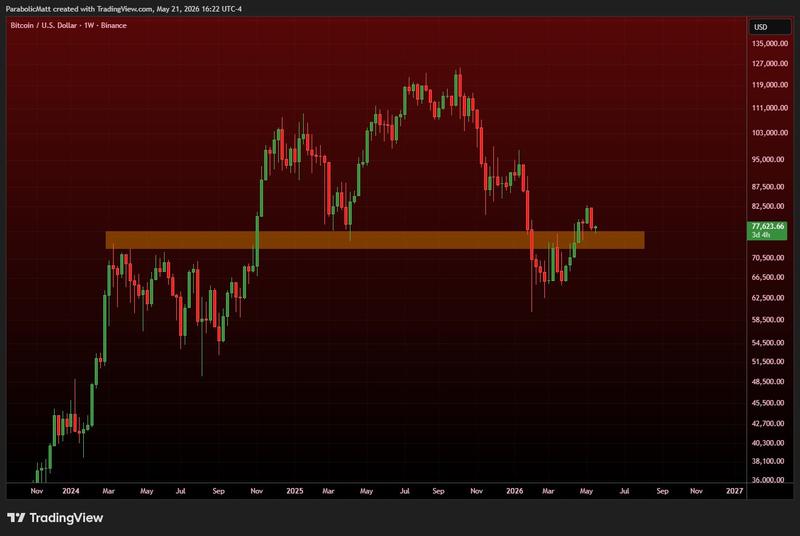
A chart included with his analysis demonstrates that resistance levels were successfully breached when the price initially surpassed and sustained levels above $77,000.
"Both of these characteristics are characteristics of a bull market rally NOT a bear market rally," Hyland reiterated.
Higher resistance level needed for bull confirmation: Analyst
Regarding the potential conclusion of the bear market, independent analyst Filbfilb maintains that a more elevated resistance level must be reclaimed before confirming that bullish forces have regained dominance.
The weekly supertrend indicator for Bitcoin, presently positioned near $90,000, represents the critical threshold requiring attention.
"The last 2 BTC bear markets ended with a >+20% weekly candle and a break of the weekly super trend - presently around $ 88k," he told X followers.
"If the bearish move we see in play at the moment fails, I'm expecting one of those candles to happen rather than much messing about around these levels."
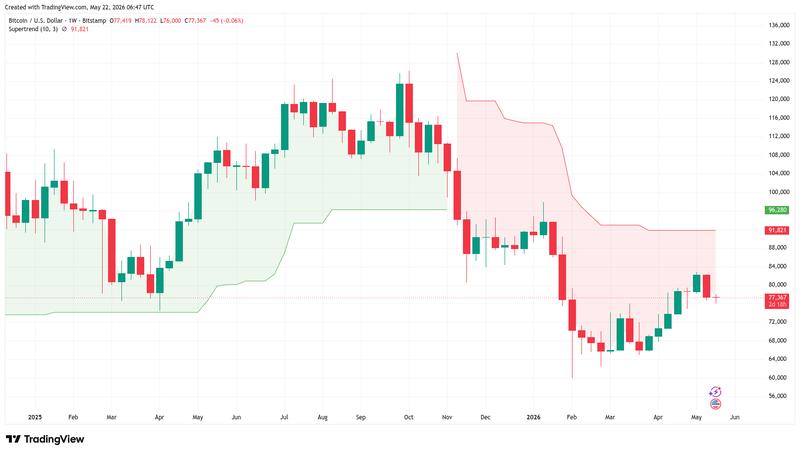
The supertrend indicator derives its calculation from the average true range of price movements, combined with a multiplier factor. The last instance of BTC/USD recording a weekly closing price above the supertrend line occurred during early November 2025.