Rare Technical Indicator Signals Fourth Historic Bullish Pattern for Bitcoin
A scarce Fisher Transform crossover has emerged, marking just the fourth occurrence of this bullish signal throughout Bitcoin's entire trading history.

According to a time-tested trading indicator, Bitcoin (BTC) is displaying compelling evidence that its most recent long-term bottom has already been established.
Key points:
- The Fisher Transform indicator generated a monthly bullish crossover in August, representing just the fourth instance in Bitcoin's entire history, as highlighted by Willy Woo.
- Earlier monthly crossovers coincided with the conclusion of Bitcoin bear markets, such as in late 2022, when the Fisher Transform Indicator reached -3.83.
- Weekly time frames revealed a continuing bullish divergence, mirroring the final phases of the 2022 BTC price downward trend.
Market analyst identifies signals of genuine BTC price turnaround
During a Friday X thread, analyst Willy Woo highlighted significant readings from the Fisher Transform indicator, a trend analysis tool for price action that was developed in 2002.
This indicator works by smoothing out an asset's price movements to generate a chart displaying trend strength that's easy to interpret. Unlike ordinary statistical data, market prices have a tendency to spend extended periods around extreme values. The Fisher transform addresses this issue through the application of a logarithmic-based transformation.
Two trend lines make up the indicator: the Fisher line and the trigger line, both of which oscillate on a scale centered at zero. The trigger line originates from the Fisher line, appearing with a one-period delay in its plotting.
According to Woo's analysis for Bitcoin, a pronounced upward reversal in Fisher—marked by the intersection of its two trend lines—has historically aligned with bear-market bottoms when examined on monthly time frames.
BTC bottoms: 3 for 3 without fake out. Latest cross is the 4th on record
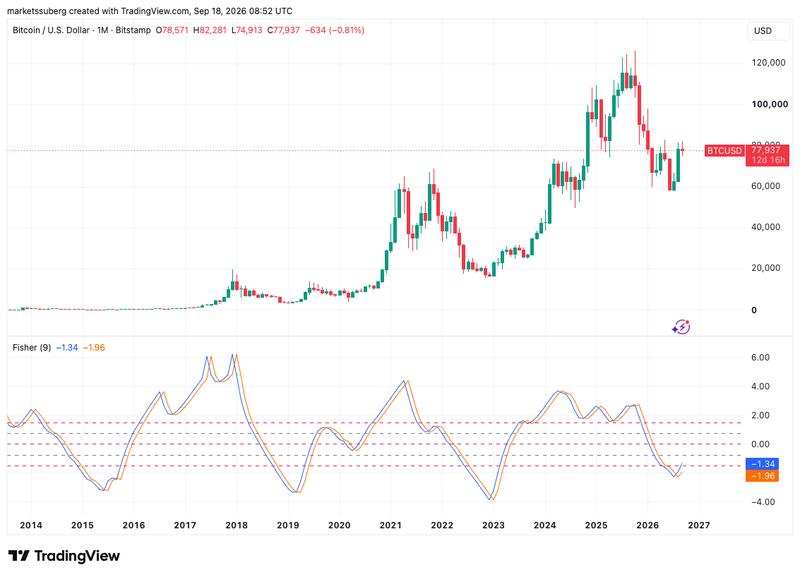
During July, the crossover in question materialized at -2.26, and should it continue developing as expected, historical patterns indicate that BTC/USD will initiate a fresh macro uptrend. Nevertheless, Woo observes that price action could still undergo consolidation and move lower, citing a parallel phenomenon during bull markets in which Fisher generated a bearish crossover, subsequently producing another bullish one at a later stage.
He contends this occurs because of speculative traders' presence during extended BTC price uptrends, who affect market momentum due to their sensitivity to near-term price fluctuations. Conversely, during bear-market bottom formations, these traders are largely absent, which enhances the dependability of Fisher bottom signals.
When price falls to a point where investors find value, buy-pressure fires back up but we are devoid of speculators. Price reverses more cleanly without the choppy fake outs seen in tops. Hence bottoms are easier to define. This is seen in many signals, also seen in the Fisher Transform here
Fisher bullish divergence mirrors 2022 bear market patterns
Throughout 2026, the weekly chart reveals another developing Fisher bull structure. On this time frame, the indicator registered its swing low at -2.85 at the close of December last year, while BTC/USD was still trading near approximately $90,000.
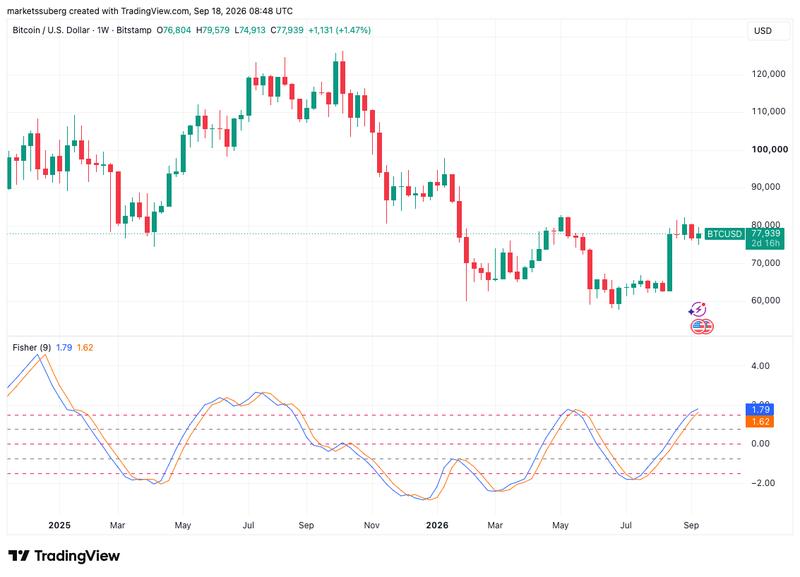
From that point forward, Fisher has produced a series of higher lows even as price action itself records lower lows, forming a bullish divergence. An identical pattern materialized in 2022, with Fisher's bullish divergence emerging throughout the final six-month period of Bitcoin's prior bear market.
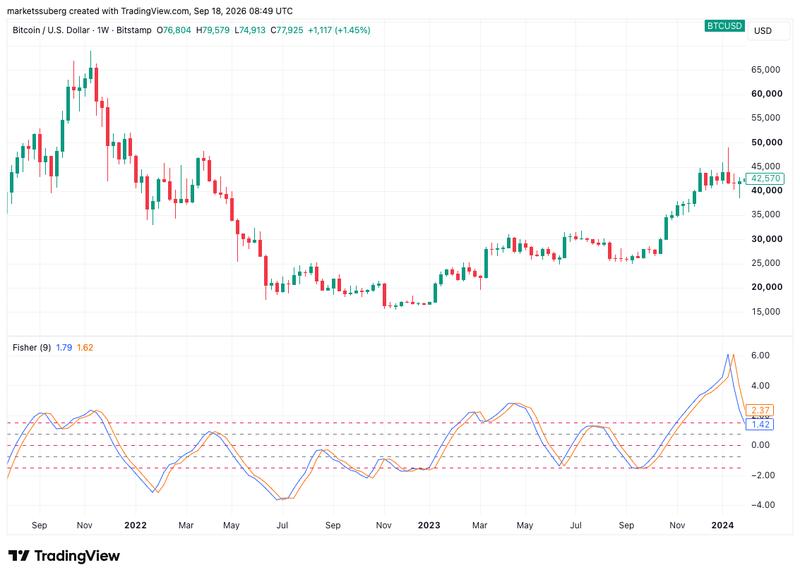
Although numerous onchain metrics have activated bear-market reversal signals during recent months, uncertainty persists regarding whether Bitcoin's 21-month lows approaching $57,000 on July 1 genuinely represented a new cycle bottom.
During the previous week, Woo himself observed an absence of characteristic buyer interest at these low levels, with bid-side activity indicating that merely a small number of high-volume investors were accumulating during that period.