Potential Bitcoin Price Decline: What Happens if $60K Level Breaks?
Technical analysis points to potential Bitcoin decline toward $50,000, with more bearish weekly patterns suggesting a possible correction extending to $33,000.

Bitcoin (BTC) is on track to record its most significant weekly decline since November 2022, posting approximately 15% losses week-to-date as of Friday's trading session.
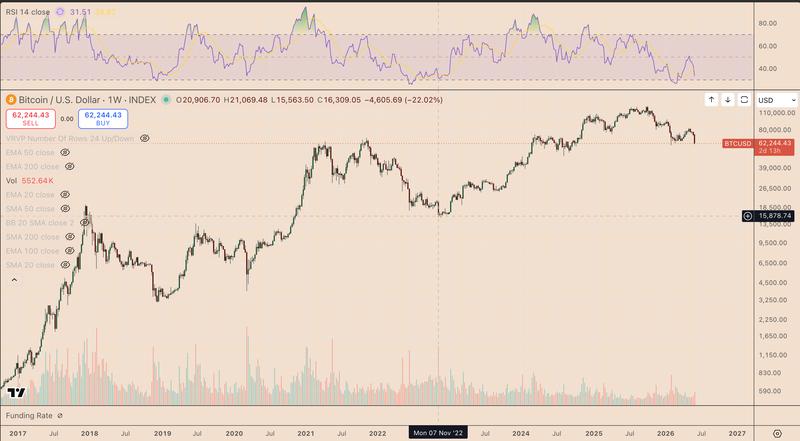
The leading cryptocurrency was changing hands around $62,500 following a brief dip toward the $61,000 threshold earlier during the trading day. This approximately $1,500 bounce back indicates that buyers continue their attempts to protect the psychologically significant $60,000 support threshold.
What are the potential downside levels for Bitcoin should it breach the $60,000 mark?
Key takeaways:
- The cryptocurrency is currently testing its 200-week SMA positioned around $61,800, a threshold that has previously served as significant cycle support throughout history.
- Market analyst suggests $55,000 could represent Bitcoin's maximum downside potential assuming the 200-week SMA remains intact.
Analyst Projects $55,000 as Maximum Downside Scenario for Bitcoin
The leading cryptocurrency may experience a temporary wick beneath the $60,000 level before encountering more robust buying interest, according to market analyst Radz.
In his Friday analysis, he indicated that $55,000 might represent the "worst" potential downside for Bitcoin, pointing to the 200-week simple moving average (200-day SMA, pink) as the primary factor supporting his optimistic perspective.
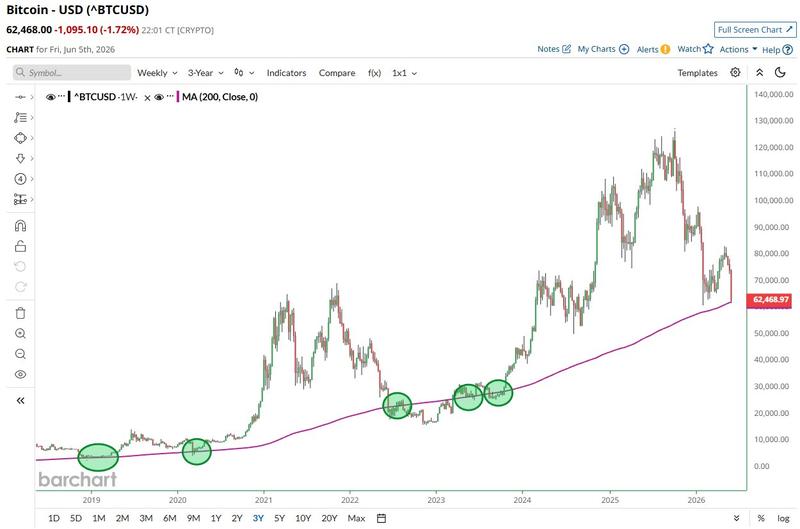
This indicator has historically functioned as among Bitcoin's most robust long-term support areas. Earlier retests of the 200-week moving average during 2019, 2020, 2022 and 2023 consistently marked significant cycle bottoms that led to powerful recovery movements.
During February 2026, Bitcoin experienced an increase exceeding 37% following its test of the 200-week SMA as a support level. The current week represents BTC's second attempt during this year to maintain position above the pink line, as it hovers near $62,000.
Bearish Flag Pattern Signals Potential Deeper Decline Toward $50,000
An emerging bear flag pattern on Bitcoin's technical chart indicates the correction phase might extend significantly below the $55,000 region.
As of Friday's session, BTC had penetrated beneath the flag's lower boundary line, with increasing trading volume demonstrating enhanced conviction supporting the downward movement. Within technical analysis frameworks, a bear flag develops when price action consolidates upward within a narrow channel following a steep decline, prior to continuing the previous downward trend.
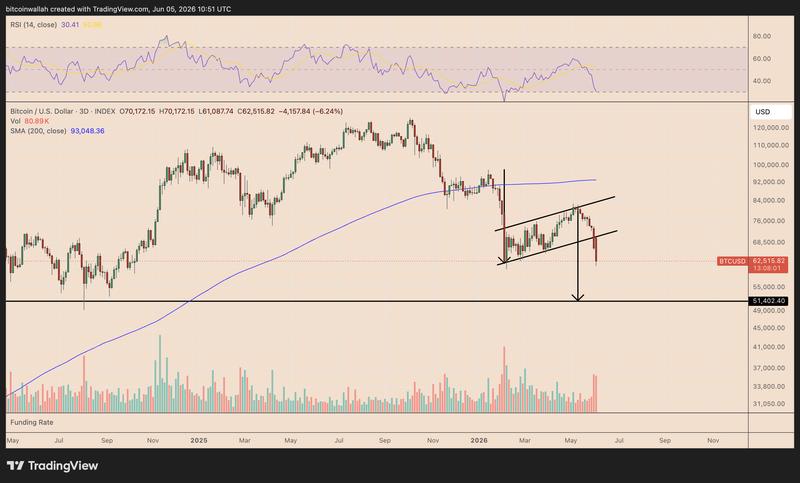
The projected target gets calculated through subtracting the height of the initial decline from the breakdown location. For Bitcoin's current situation, this calculation projects a downside objective around the $50,000–$51,000 support area.
This region also corresponds with prior horizontal support levels, establishing it as the subsequent major threshold to monitor should BTC prove unable to recapture the flag's lower boundary line throughout the coming days.
Onchain Metrics Suggest $50,000–$54,000 Price Target for Bitcoin
Bitcoin's onchain metrics indicate a comparable target to the bear flag technical pattern.
Glassnode's MVRV pricing bands display BTC's realized price (purple) positioned around $53,740. Put simply, realized price represents the average price level at which the Bitcoin supply most recently transferred onchain. Throughout history, this threshold has functioned as a significant support level during corrective cycles.
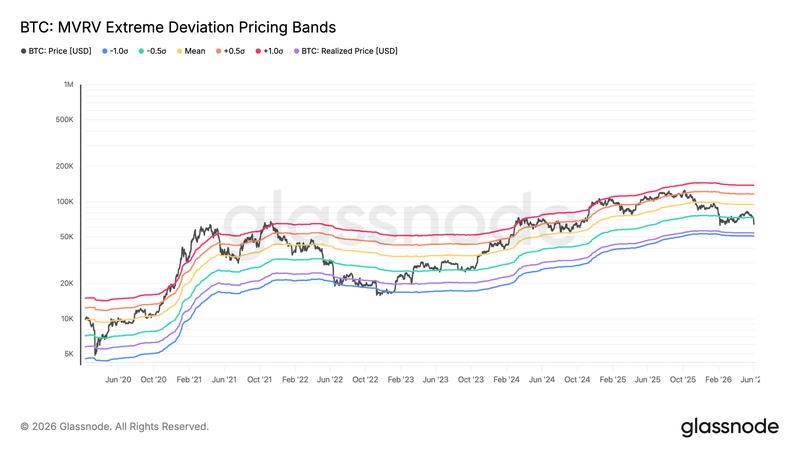
The identical chart additionally reveals another critical support threshold (blue) positioned around $50,560, representing a level where Bitcoin would appear considerably undervalued according to onchain valuation metrics.
Combined, these indicators establish a support area ranging approximately between $50,000 and $54,000. This range aligns closely with the bear flag projection around $50,000 to $51,000.
Cup-and-Handle Breakdown Pattern Points to Potential $33,000 Decline
Bitcoin's weekly timeframe chart is displaying an additional bearish formation: a potential cup-and-handle breakdown pattern.
The configuration shows BTC developing a rounded top formation, subsequently followed by a smaller recovery effort within the handle portion. Bitcoin price action is currently weakening around the lower boundary of that handle, positioned close to the 200-week SMA and the $60,000 support threshold.
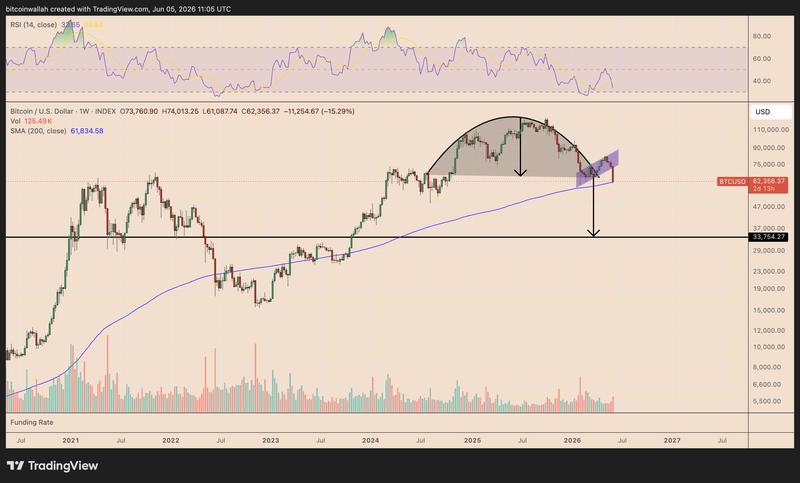
Should Bitcoin break beneath this region decisively, the downside objective derived from the pattern is located around $33,000.