Notorious ETH Whale Returns With Massive $19.7M Short Position After October 2025 Crash Success
A prominent Ethereum whale resurfaces with a substantial $19.7 million short bet while technical analysis suggests ETH could drop to $1,375.

A major Ethereum whale who successfully shorted Ether (ETH) throughout the October 2025 cryptocurrency market crash has reemerged following an eight-month period of inactivity.
Key takeaways:
- A prominent Ethereum whale initiates a $19.72 million 20x leveraged ETH short position in proximity to the $1,500 support level.
- Technical indicators showing ETH's bear flag formation suggest a potential decline to $1,375, potentially generating approximately $2.39 million in gains for the whale.
Major Ethereum whale initiates 20x leveraged short following eight-month absence
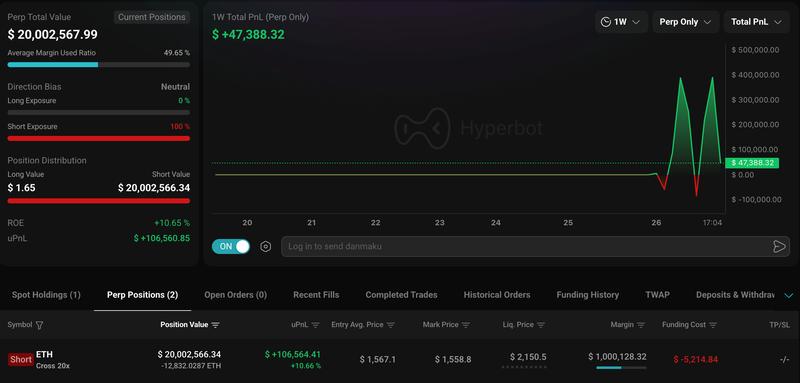
This past Friday, the cryptocurrency wallet identified as '0xf83f...6728' initiated a 20x-leveraged short position on ETH valued at $19.72 million just as Ether arrived at the $1,500 support level following an 18.25% price decline throughout the previous two-week period.
Data from Hyperbot indicates that the position was established at an average entry price of approximately $1,565. At the time of publication, the whale trader had accumulated close to $106,500 in unrealized gains as the ETH price hovered around the $1,550 price point.
The bearish momentum within the Ethereum marketplace has mirrored a wider technology-driven risk asset selloff, with market participants reducing their exposure to speculative investments as the Nasdaq index and semiconductor stocks experienced downward pressure.
Sentiment specific to Ethereum has deteriorated even more considerably following intensified examination of the Ethereum Foundation, coming after media coverage of budget reductions, workforce layoffs and a series of high-level executive exits that have sparked concerns regarding the organization's leadership continuity.
Technical analysis indicates that Ether may be targeting a price decline toward the $1,375 price level should it follow through with the breakdown from its current bear flag chart formation.
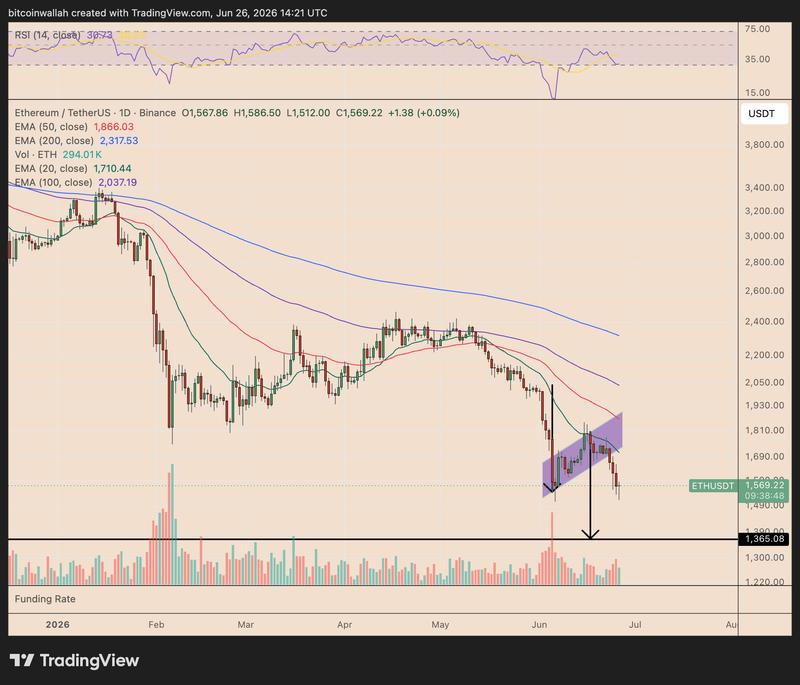
Should ETH decline to the $1,375 price target, the whale trader's unrealized gains would climb to approximately $2.39 million prior to accounting for exchange fees and funding costs, calculated from the position's estimated $1,565 entry point.
Identical whale executed ETH short near the peak of October 2025 crash
The wallet's most recent trading activity is noteworthy due to its proven track record.
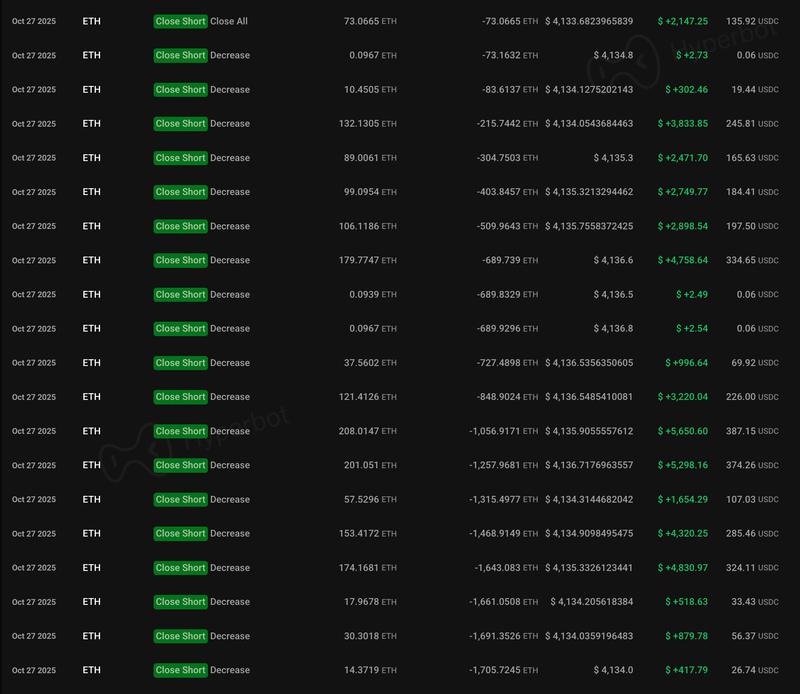
Blockchain transaction records reveal that wallet '0xf83f...6728' previously became active on Oct. 27, 2025, at which time it established an ETH short position near the $4,172 price level as market volatility stemming from the October cryptocurrency market crash began to subside.
The market participant subsequently exited the position in the vicinity of $4,133, securing $41,693 in net gains following the deduction of $5,263 in trading platform fees.
The whale's present trading approach appears consistent with previous tactics: establish short positions on ETH during market weakness, utilize substantial leverage, and capitalize on downward price momentum. The magnitude has shifted dramatically, though, given that the current position involves nearly $20 million in notional value, representing a significantly larger commitment than the whale's October 2025 trading activity.
Potential ETH double bottom formation could jeopardize the whale's short position
The whale's pessimistic wager does carry substantial risk factors.
As of Friday's trading session, Ether's daily price chart displayed a possible double bottom chart pattern forming near the $1,500–$1,512 support region, a zone where purchasing activity emerged on two separate occasions during June. While the technical formation remains unconfirmed at this stage, a powerful recovery from this price zone has the potential to redirect near-term market momentum in favor of bullish traders.
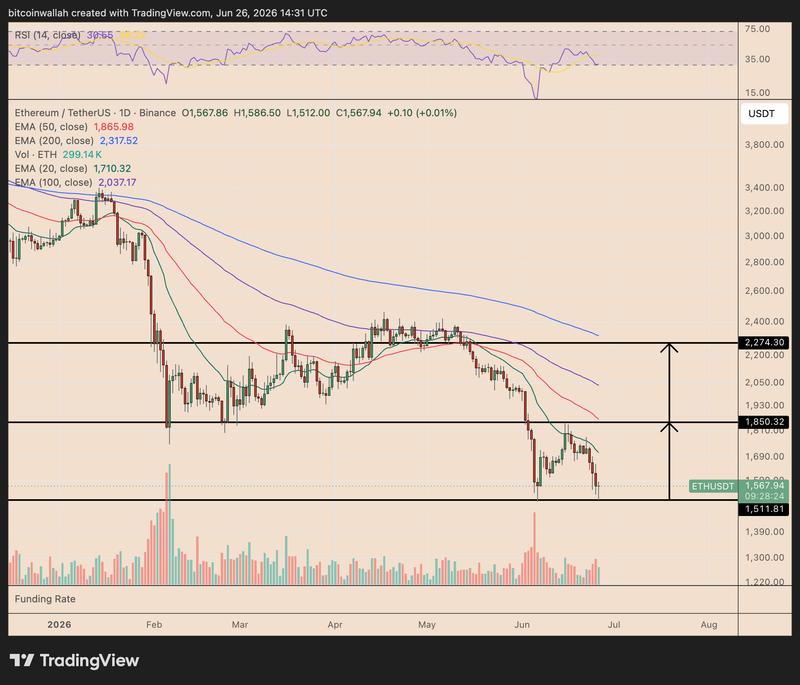
The critical price threshold to monitor is the neckline positioned near $1,850. A conclusive daily candle closure above that technical level would validate the double bottom chart pattern and create the possibility for a measured upward movement toward approximately $2,190, determined by measuring the vertical distance between the neckline and the $1,512 bottom formation.
Such a price movement would bring ETH dangerously close to the whale's liquidation threshold near $2,150, indicating that a validated bullish price reversal could create significant pressure on or potentially eliminate the entire short position unless the trader increases margin collateral or decreases position size.