MSTR Could Face 80% Drop If Historical Dot-Com Pattern Repeats Itself
With cash reserves declining 38% and dividend payments approaching $1.2 billion, Strategy faces mounting dilution concerns for MSTR investors.

Strategy (MSTR), led by Michael Saylor, is currently exhibiting a technical pattern reminiscent of the one that preceded the stock's catastrophic 99% decline during the early 2000s dot-com bubble collapse.
Key takeaways:
- A monthly head-and-shoulders formation similar to the dot-com crash pattern is currently being tested by MSTR.
- Declining cash reserves combined with escalating dividend responsibilities are amplifying the potential for dilution among MSTR common stock holders.
Head-and-shoulders formation suggests 80% potential decline for MSTR
By the end of June, MSTR's monthly technical chart revealed a developing head-and-shoulders (H&S) formation.
This H&S formation emerges when three distinct peaks appear in price action, where the central peak, known as the "head," rises higher than the flanking peaks, termed "shoulders." A neckline forms as the support level that links the significant retracements occurring between these peaks.
Typically, this pattern completes when price action breaks beneath the neckline and, under ideal conditions, declines by a distance equivalent to the maximum gap between the head's peak and the neckline.
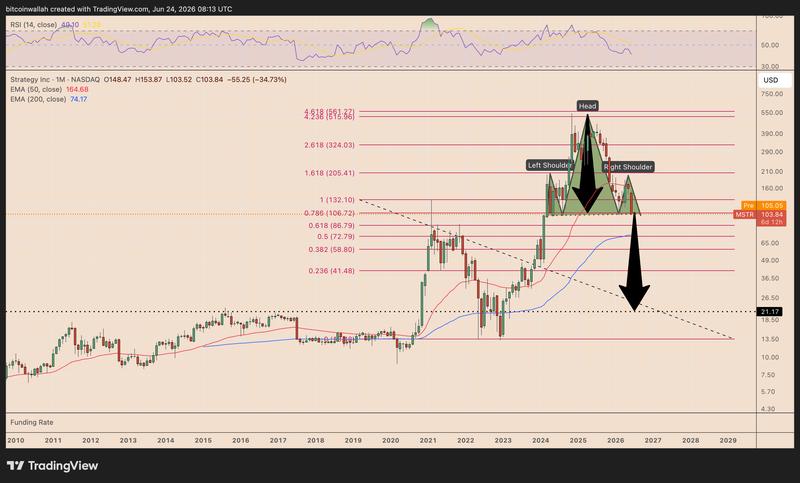
Since March 2024, MSTR has developed a textbook H&S formation and faces potential breakdown risk below neckline support situated at the $100–$105 level.
Should the price decisively breach this level, it would validate the bearish formation. Such a move could trigger an extended, multi-year downward correction targeting approximately $20, representing roughly an 80% decline from present price levels.
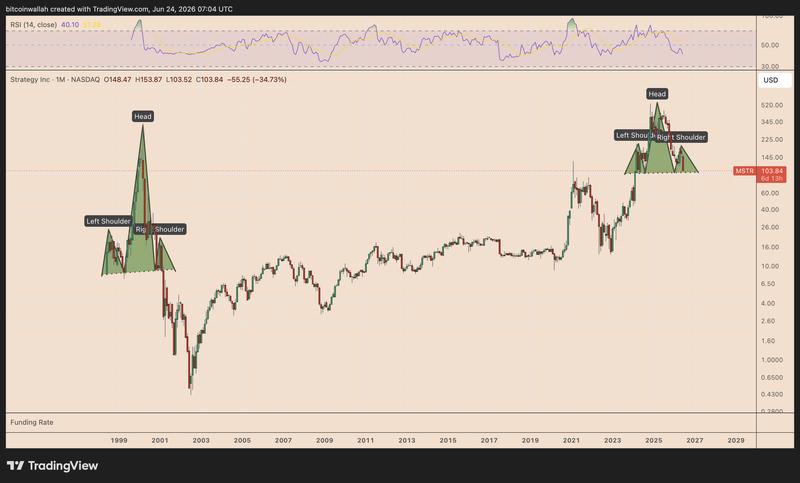
This current structure bears striking resemblance to the head-and-shoulders top that MSTR completed during the dot-com bubble period. At that time, the stock breached a similar neckline configuration before plummeting more than 99% from its all-time high within a two-year timeframe.
Tightening cash position at Strategy heightens dilution concerns for MSTR investors
MSTR, Strategy's common stock, confronts heightened dilution concerns as the company experiences declining cash reserves alongside mounting preferred-stock dividend requirements.
Through June, Strategy's dollar-denominated cash holdings decreased by 38% from early 2026 levels, while annual dividend commitments nearly quadrupled to reach $1.2 billion, based on analysis from CryptoQuant's Julio Moreno.
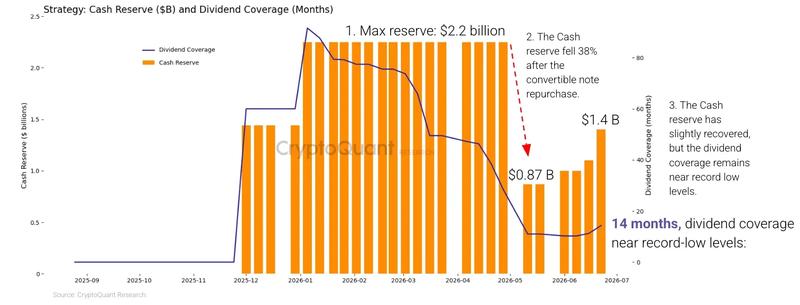
Strategy allocates cash resources to fulfill dividend payments on its preferred stock instruments, with Stretch (STRC) being the primary recipient.
However, according to Moreno, Strategy's preferred-dividend coverage capacity has contracted to approximately 14 months from over seven years previously, indicating the company currently maintains sufficient cash to satisfy just slightly more than one year's worth of STRC dividend distributions.
This financial pressure has manifested in STRC's trading price. Last week, STRC reached an all-time low of $82.50 and has subsequently traded predominantly within the $82 to $89 range, significantly beneath its $100 par value.
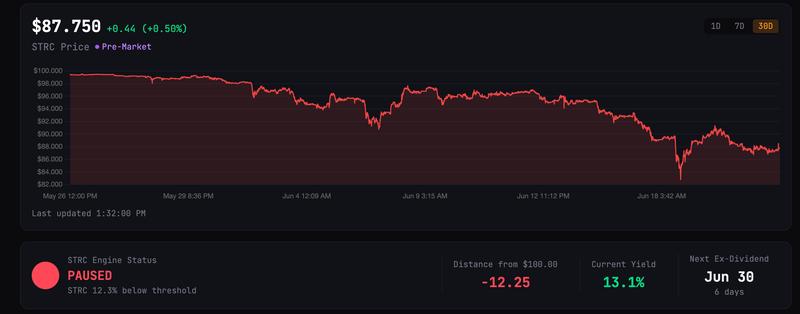
This price deterioration has elevated STRC's effective yield beyond 13%, in contrast to its nominal dividend rate of approximately 11.5%, demonstrating that investors require higher compensation to maintain positions.
"Given current annual dividend obligations of $1.2 billion, achieving 24 months of coverage would necessitate cash reserves of approximately $2.8 billion, nearly double Strategy's present holdings," Moreno stated, adding:
"A higher cash reserve is the most direct signal the market needs to regain confidence in STRC."
Strategy's Bitcoin holdings total 847,363 BTC, purchased at an average cost basis of approximately $75,650 per coin, exceeding the current BTC market price of roughly $62,600. Liquidating Bitcoin amid market weakness would crystallize realized losses and undermine its established accumulation strategy narrative.
Alternatively, Strategy has increased STRC's dividend rate and issued additional MSTR common stock to generate cash. As an example, the company sold 2.71 million MSTR common shares generating approximately $335.5 million during June, while allocating only $34.9 million from these proceeds toward purchasing 520 BTC.
This approach preserves Strategy's Bitcoin position essentially unchanged, though it amplifies dilution exposure for current MSTR common stockholders.
Should STRC continue trading below $100, Strategy may face continued common share issuances, reduced Bitcoin acquisition activity, or the necessity to replenish cash reserves. Any of these alternatives could pressure MSTR as the stock confronts a potentially bearish technical breakdown scenario.