Looming death cross signals potential BTC decline despite $73K price recovery
Bitcoin analysts warn that the bear market may persist unless significant bullish momentum emerges, as a critical death cross pattern approaches confirmation.
The latest technical analysis suggests that Bitcoin (BTC) requires a "major bullish catalyst" to prevent the reversal of gains made during its March recovery period.
Key points:
- Recent analysis indicates that near-term BTC price gains don't eliminate the possibility of extended bearish market conditions.
- The cryptocurrency encounters significant resistance levels throughout the mid-$70,000 range.
- An impending "death cross" pattern involving two weekly trend lines remains set to materialize within the current week.
Multiple trend lines create resistance zone for BTC price
Through a Wednesday post on X, Keith Alan, who cofounded the trading resource Material Indicators, cautioned that Bitcoin price vulnerability persists when examining timeframes beyond the shorter intervals.
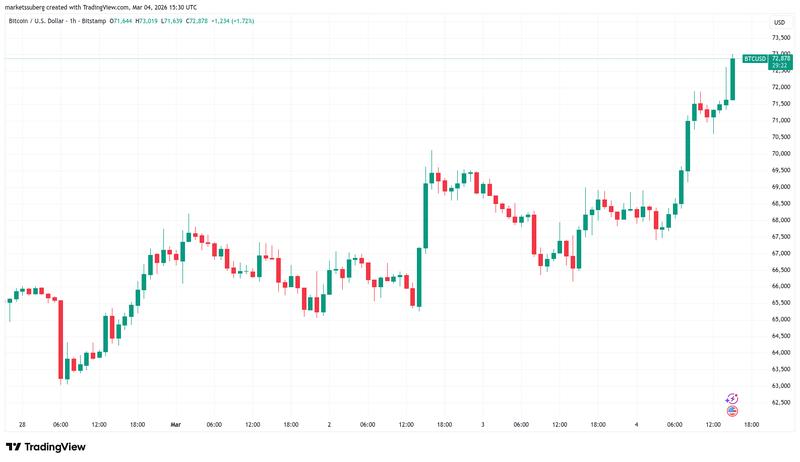
The cryptocurrency reached its highest point of the month at $73,019 during Wall Street's opening session on Wednesday, extending a recovery that coincided with escalating tensions in the Middle East region.
Despite this upward movement quickly prompting forecasts of a bull market resurgence and potential new record highs, Alan delivered a straightforward assessment regarding Bitcoin's price trajectory.
"This is an important candle to watch on the $BTC chart," he summarized.
"On the surface, we're seeing a short squeeze. From a technical perspective, this D candle is attempting to validate R/S Flips at the 21-Day SMA, the 2021 Top at $69k, and a Timescape Level at $71.3k."
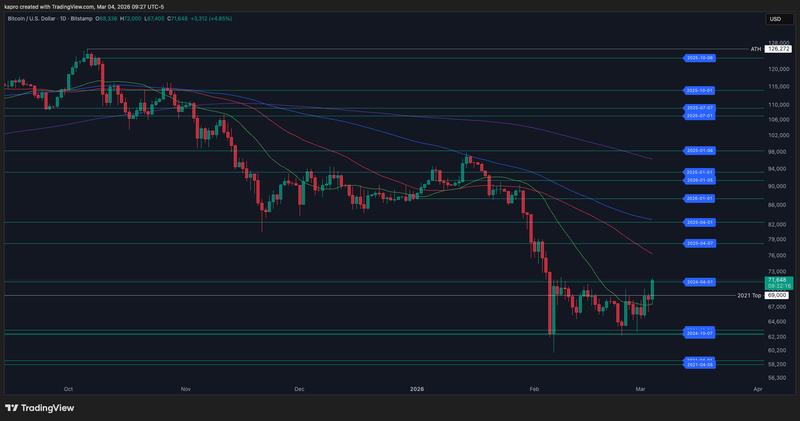
Alan highlighted multiple significant price levels in proximity to the current spot price, including the 21-day simple moving average (SMA) positioned around $67,550, according to TradingView data.
Additional monitored levels included the 50-day SMA at $76,350, alongside the 21-week and 100-day SMA trend lines positioned at $88,000 and $87,300, respectively.
"If bulls can push price up from here I expect some friction around psychological resistance ~$75k, technical resistance at the $50-Day MA, and the next Timescape Level at $78.3k," he continued.
"A support test, sooner than later, would be healthy, but I'm not sure that the market is going to make it that easy on us. However this develops, IMO, the longer it takes to grind up, the more durable the rally will likely be."
Weekly candle set to confirm Bitcoin death cross pattern
Previous Cointelegraph coverage noted that projections for the ongoing bear market's long-term trajectory suggest a potential bottom at the $50,000 level or potentially lower.
Alan cautioned that a renewed downward movement in BTC price could materialize as early as the following week, driven by an anticipated "death cross" pattern involving the 21-week and 100-week SMAs.
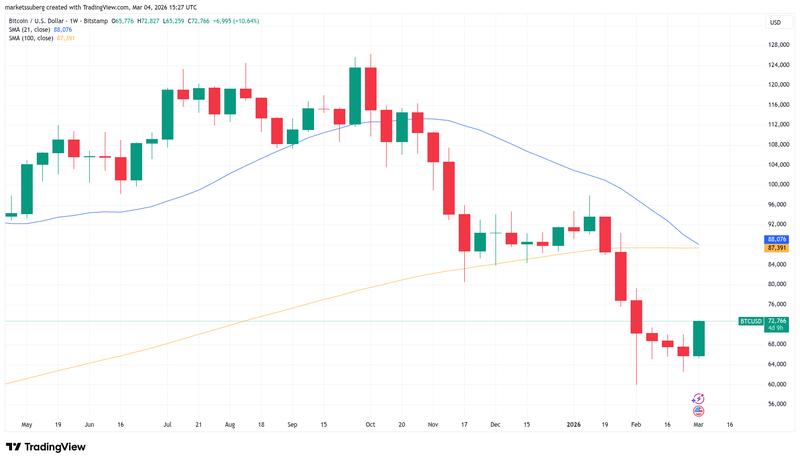
The death cross formation emerges when the former trend line descends below the latter, signaling that recent price performance has weakened relative to the extended-term trend.
"The caveat to that is the simple fact that next week we will print a death cross between the 21 and 100 Week MAs, and that will likely be a precursor to the next leg down unless we get a major bullish catalyst," he concluded.