Hyperliquid's HYPE Token Soars 23% in 24 Hours: What's Behind the Rally?
The HYPE token experiences a dramatic surge driven by new spot ETF products, a strategic USDC partnership with Coinbase, and technical indicators pointing toward potential May rally continuation.


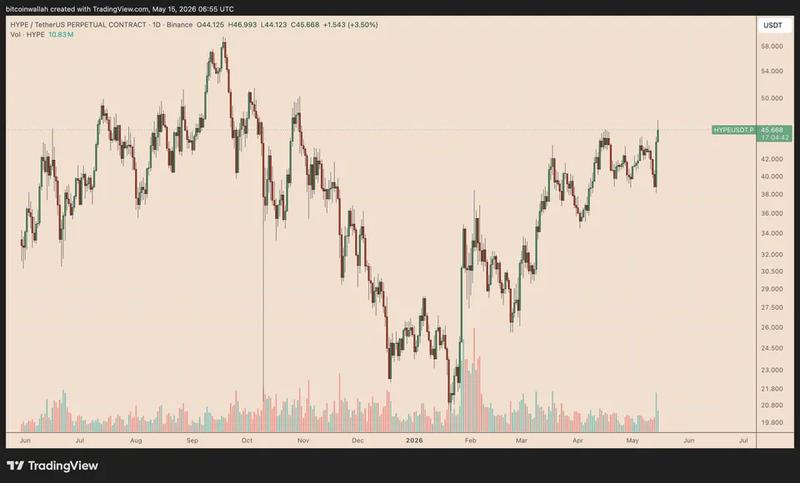
The native token of the Hyperliquid decentralized exchange, HYPE, experienced a surge exceeding 23% over the past day, reaching approximately $47 on Friday and marking its strongest performance since October 2025.
The question now centers on what's fueling this unexpected surge in HYPE's valuation, and whether the cryptocurrency possesses sufficient strength to maintain its bullish trajectory in upcoming trading sessions.
Key takeaways:
- Several US spot HYPE ETF products launching this week have reinforced the narrative around institutional appetite for the token.
- The partnership making Coinbase the USDC treasury deployer for Hyperliquid has contributed to upward price pressure on HYPE.
Spot HYPE ETF debuts spark institutional appetite speculation
The primary near-term driver propelling HYPE's price surge seems to be the introduction of Hyperliquid exchange-traded products listed in the United States.
Friday saw Bitwise introduce its spot Hyperliquid ETF to the market, available under the NYSE ticker BHYP.
This investment vehicle offers investors compliant access to HYPE exposure and plans to stake some of its holdings via Bitwise's proprietary staking operation. The sponsor fee stands at 0.34%, though it will be completely waived during the initial month for the first $500 million in managed assets.
This product follows the Hyperliquid ETF from 21Shares, trading as THYP, which began trading on the Nasdaq earlier this week on Tuesday.
Just one day afterward, the onchain analytics platform Lookonchain reported that wallet addresses associated with the venture capital powerhouse a16z had acquired approximately $67.5 million in HYPE tokens.
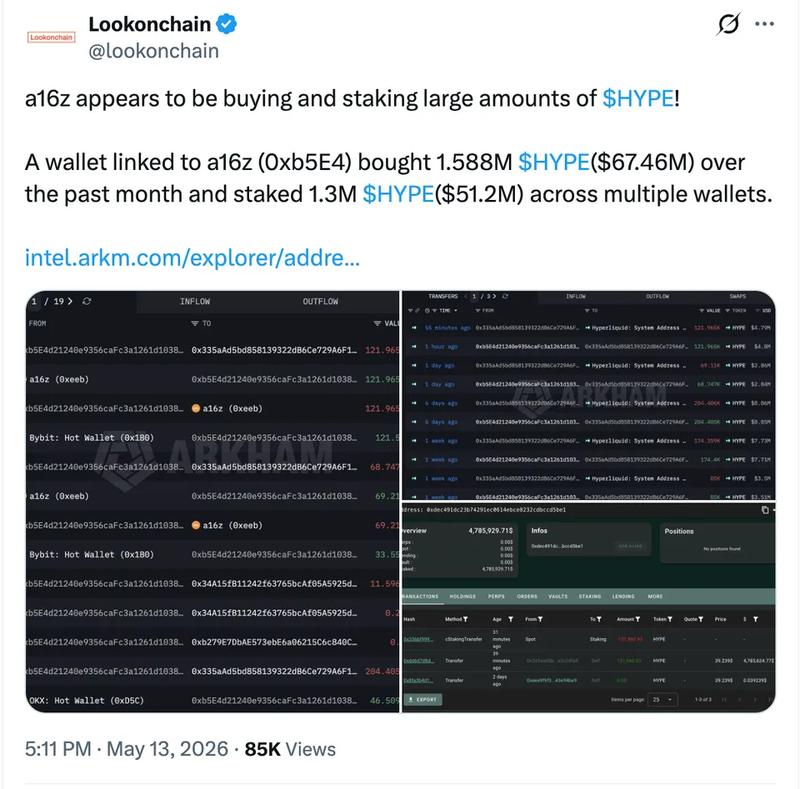
These acquisitions allegedly occurred during the month preceding the ETF product launches, contributing to evidence of increasing institutional appetite for exposure to Hyperliquid.
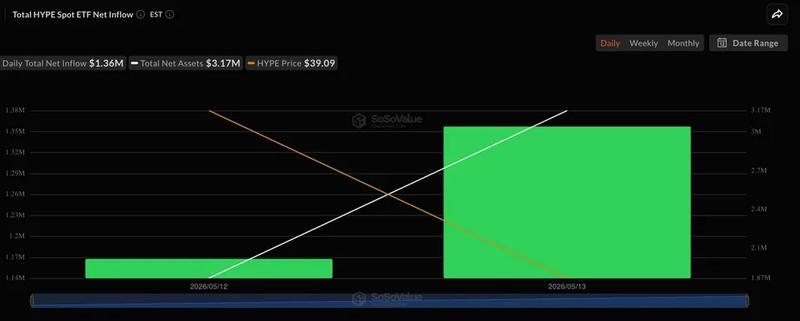
Whether the upward momentum continues throughout May will probably hinge on the HYPE ETFs' ability to draw substantial capital inflows beyond the hype of their initial launch period.
According to data from SoSoValue, the products were managing approximately $3.17 million in total assets as of Friday.
Strategic Coinbase and Circle partnership provides fundamental support for HYPE price movement
Additional upward momentum for HYPE emerged following Coinbase's Thursday announcement that it had assumed the role of official treasury deployer for USDC on the Hyperliquid platform.
This partnership reinforces USDC's position as the primary collateral and quote currency throughout Hyperliquid's onchain trading infrastructure.
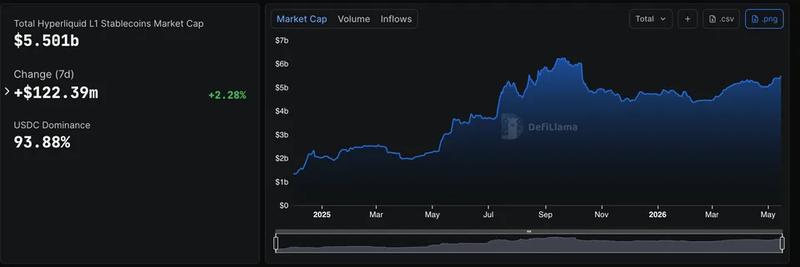
According to DefiLlama data, the stablecoin currently represents approximately $5 billion in circulating supply on Hyperliquid, establishing it as the ecosystem's leading stablecoin.
Within the enhanced AQAv2 framework, Coinbase is anticipated to distribute the overwhelming majority of reserve-yield income generated from USDC deployed on Hyperliquid back to the protocol itself.
Additionally, Circle will function as the technical deployer for USDC on the Hyperliquid network and has pledged to stake 500,000 HYPE tokens.
In a Thursday social media post, analyst Aylo characterized the development as follows:
"It's an admission that Hyperliquid is too dominant in perps to displace, so better to align and capture distribution,"
Aylo further noted:
"We should see an increase of ~$140M+ in annualised revenue which will be used to buyback HYPE."
US regulatory developments via CLARITY Act provide favorable macro backdrop
The HYPE price rally also coincided with encouraging developments in United States cryptocurrency regulatory frameworks.
The Senate Banking Committee moved the CLARITY Act forward on May 14 with a vote of 15–9, representing an important milestone for legislation designed to establish clearer boundaries between securities and commodities classifications for digital assets.
This development boosted overall sentiment throughout cryptocurrency markets, triggering same-day price increases across Bitcoin, Ethereum, XRP and numerous other leading cryptocurrencies.
However, the CLARITY Act has not yet achieved full legal status. The proposed legislation must now proceed to the full Senate, where securing sufficient bipartisan backing to navigate procedural obstacles will likely prove necessary.
Should the Senate approve the measure, congressional lawmakers would then face the task of reconciling differences between Senate and House versions before presenting unified legislation to President Donald Trump for his signature.
Technical pattern suggests potential 30% HYPE price pullback risk
The current upward price action in HYPE continues to develop within what technical analysts identify as a rising wedge formation, characterized by price movement contained between two converging trend lines that both slope upward.
Within technical analysis frameworks, this wedge pattern traditionally resolves when price action breaks beneath the lower trend line boundary and declines by a distance equivalent to the structure's maximum vertical height.
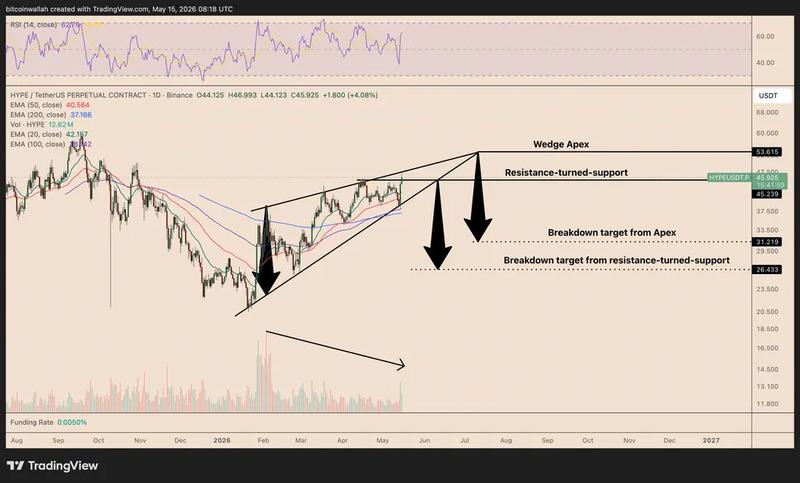
When this technical principle is applied to HYPE's current price chart, the resulting downside price objective falls within the $26.5–$31.20 range, with the specific level depending on where the breakdown from the pattern occurs, as illustrated in the chart above. This scenario would represent a correction between 30%-45% potentially materializing by June or July.
On the other hand, should HYPE achieve a convincing breakout above the rising wedge's upper trend line boundary, it would negate the bearish technical setup entirely, potentially driving the token's price toward the $59–$60 zone, which corresponds with the 1.0 Fibonacci retracement level displayed in the chart below.

The daily relative strength index (RSI) reading for HYPE additionally reinforces the near-term optimistic outlook. This momentum indicator currently trades below the overbought threshold level of 70, indicating that additional upward price movement remains technically viable before entering overextended territory.