Glassnode Highlights Critical Demand Challenge for Bitcoin Beyond $83K as Liquidity Density Increases
Bitcoin purchasing pressure encounters resistance from converging trend lines and concentrated order-book liquidity zones as it targets $86,000 as the next critical milestone.

Bitcoin (BTC) has been unable to successfully establish $80,000 as a firm support level over the past several days, though according to fresh analysis, the most significant test for bullish momentum remains ahead.
Key points:
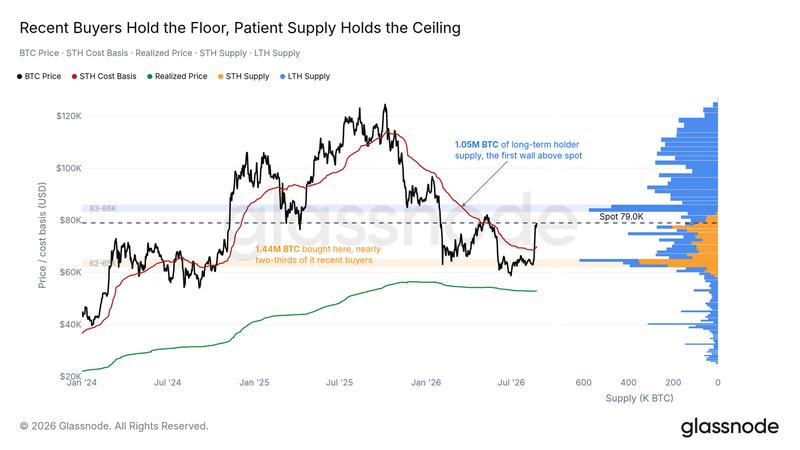
- Long-term Bitcoin holders contribute to price resistance beneath $86,000, according to Glassnode data.
- Purchasing demand needs to break through this region while Bitcoin encounters difficulty moving past $80,000.
- Several critical trend lines cluster around the current spot price, amplifying the significance of potential breakout or breakdown scenarios.
Glassnode: Key overhead liquidity structures sit between $81,000 and $86,000
Particularly noteworthy are long-term holders (LTHs) — cryptocurrency wallets that have maintained BTC positions without executing sales for a minimum of six months.
Above, the first heavy structure is $83K-86K, and effectively all of it is long-term holder supply that has sat through the entire drawdown.
According to Glassnode's forecast, ascending to $83,000 would challenge the determination of the LTH cohort to resist selling their holdings at break-even price points.
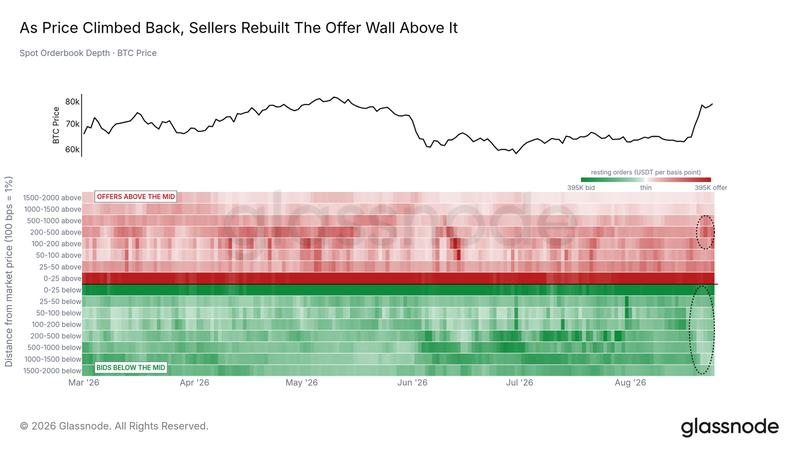
Within this identical price zone, fresh ask-side liquidity has materialized on cryptocurrency exchange order books. According to Glassnode's assessment, these order placements may not reflect genuine selling intentions, but rather represent attempts by traders to maintain positions above the spot price in anticipation of further upward movement.
The re-laddered asks join a stack of independent structure pointing at one zone. The first self-custody cost-basis shelf begins at $80.8K, dealer gamma flips negative at $82.3K, the surviving liquidation shelf runs to $86K, and the patient-supply wall fills $83K-86K. Every overhead structure we track now sits between $81K and $86K; that band is where the recovery's demand meets its test.
Trend lines converge on a narrow BTC price corridor
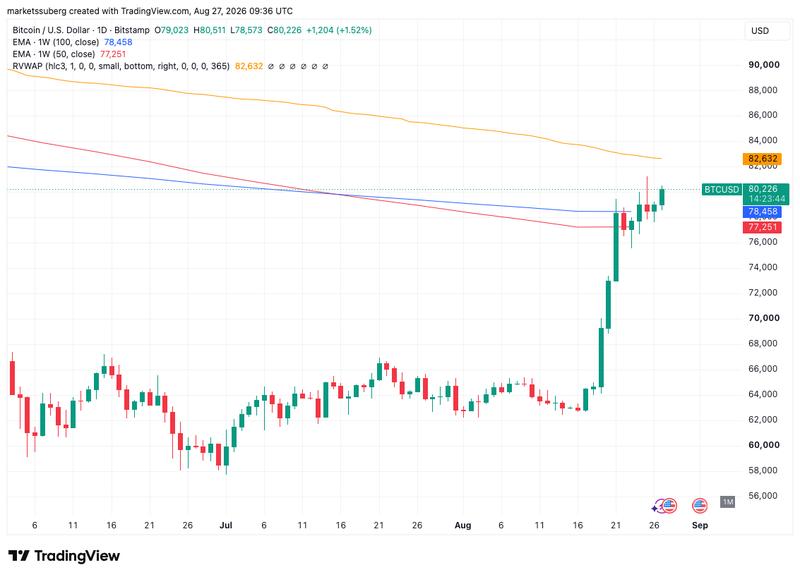
The price zone surrounding $80,000 has additionally witnessed the convergence of numerous price trend lines, reinforcing its position as a substantial resistance barrier.
The 50-week and 100-week exponential moving averages (EMAs) for Bitcoin are presently positioned at $77,353 and $78,485, respectively, based on information from TradingView. Furthermore, Bitcoin's 365-day volume-weighted average price (VWAP), which represents a moving average calculation that incorporates trading volume, is located approximately at $82,600.
In prior coverage, Cointelegraph documented the doubts expressed by market participants regarding the sustainability of Bitcoin's swift recovery trajectory. Given that typical bear market cycles are anticipated to persist through the conclusion of 2026, analyst and trader Rekt Capital emphasized that price action must demonstrate sustained support above the 50-week EMA for an extended period before any substantial trend reversal can be legitimately contemplated.