Ethereum Foundation continues ETH sales despite 10% April price rally
Despite April gains, Ether faces potential 15% decline as technical indicators reveal a bearish reversal formation on daily price charts.

Throughout April, Ether (ETH) has demonstrated impressive momentum, climbing more than 10% and touching a monthly peak of $2,430 as market sentiment has improved.
However, concurrent with this price appreciation, the Ethereum Foundation, the nonprofit entity responsible for stewarding Ethereum protocol development, has persistently executed significant sales from its treasury holdings.
Key takeaways:
- The Ethereum Foundation has sold approximately 20,000 ETH so far in 2026.
- Institutional demand for ETH remains strong, offsetting the foundation's impact on the market.
Why is the Ethereum Foundation selling ETH?
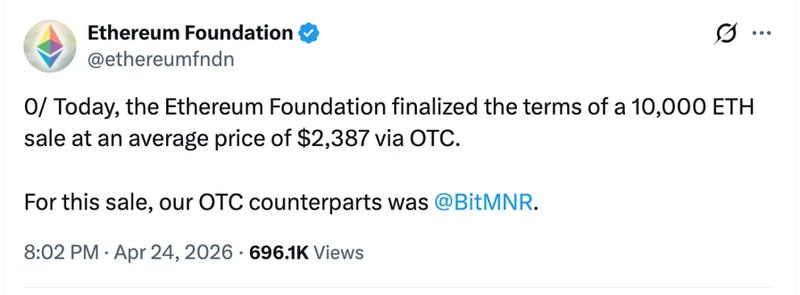
During the early days of April, the Foundation executed a transaction involving 5,000 ETH, which it converted into approximately $11 million worth of DAI stablecoins. Subsequently, a more substantial over-the-counter transaction took place, with 10,000 ETH transferred to Bitmine, the firm led by Tom Lee, at a mean price point of $2,387, generating roughly $23.9 million in proceeds.
These transactions aren't opportunistic responses to market conditions but rather represent adherence to a structured Treasury Policy that was formally implemented in June 2025.
According to this policy framework, the Foundation preserves reserves denominated in fiat currency and stablecoins sufficient to cover approximately 2.5 years worth of operational expenditures. Regular ETH liquidations serve to replenish these reserves, ensuring continuous funding for protocol development initiatives, research activities, grant programs, and broader ecosystem support efforts.
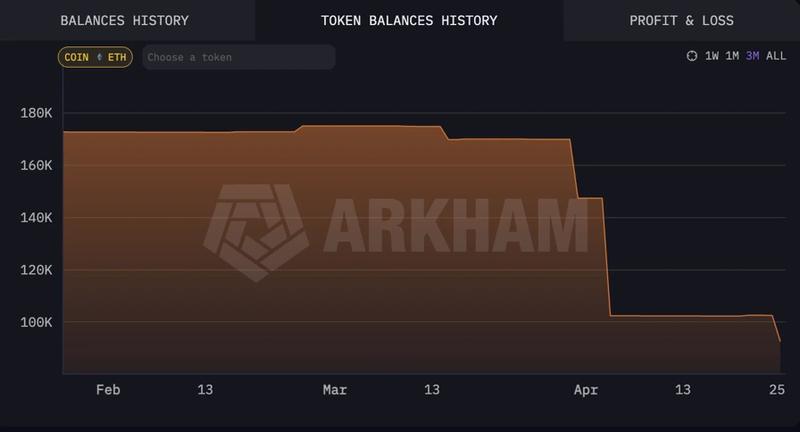
Throughout 2026 to date, the Foundation has liquidated approximately 20,000 ETH in total, generating proceeds exceeding $45 million. Its current holdings include roughly 92,500 ETH (~$215 million) maintained in liquid treasury reserves, supplemented by an additional 53,000 ETH deployed in staking operations, based on information from Arkham Intelligence, a blockchain data analytics platform.
The 53,000 ETH currently locked in staking positions could potentially produce between $4 million and $5 million in annual rewards, provided that current ETH valuations persist and the gross annual percentage yield remains within the 2.7%–3.8% range or experiences growth in future periods.
The establishment of this alternative revenue source is expected to progressively diminish the Foundation's dependence on ETH liquidations as its primary mechanism for financing operational requirements.
Are Ethereum Foundation's sales bearish for ETH?
When measured against Ether's daily trading activity, the Ethereum Foundation's ETH disposals constitute a relatively minimal proportion of overall market volume.
Individual sales ranging from 5,000 to 10,000 ETH account for merely 0.08% to 0.25% of Ethereum's typical daily trading volume, which ranges between $10 billion and $12 billion.
Given this relatively insignificant scale, the market possesses adequate capacity to absorb the Foundation's selling activity without experiencing meaningful price disruption.
Blockchain analytics reveal substantial underlying demand for ETH originating from substantial wallet holders.
To illustrate, the count of daily accumulation addresses—wallets consistently acquiring and retaining Ether—climbed to 2,434 during the current week, exceeding the quantity of exchange depositing addresses (wallets positioning assets for potential sale), which declined to 2,300, according to the data presented below.
Furthermore, spot Ethereum exchange-traded funds have documented substantial inflows across three successive weeks, capturing over $2 billion in fresh investment capital since April's commencement, per data compiled by SoSoValue.
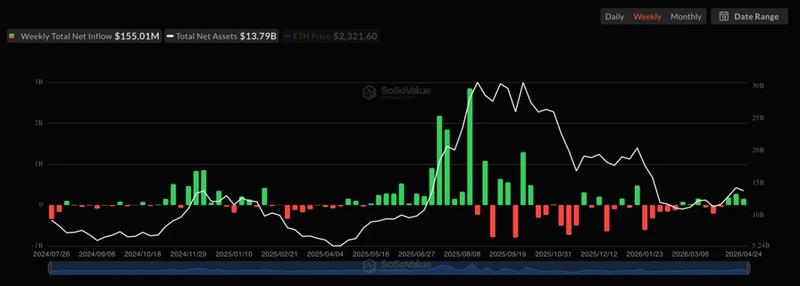
This persistent institutional capital allocation demonstrates expanding appetite for Ethereum-based investment vehicles among Wall Street participants.
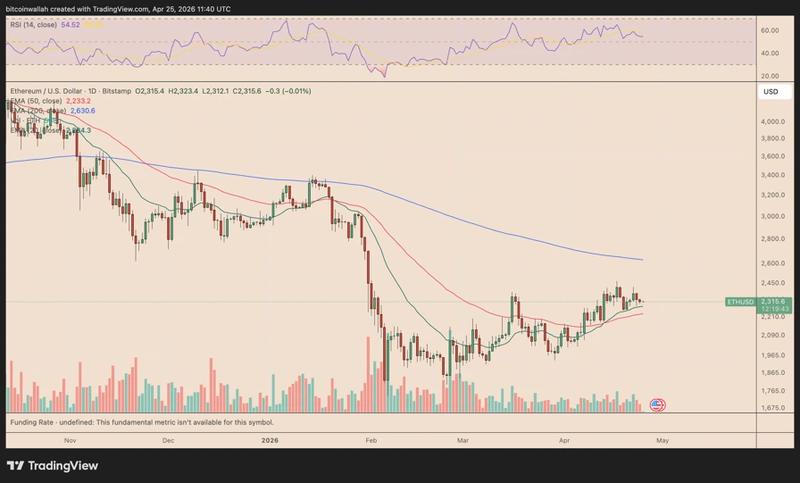
Ether's rising wedge hints at 15% dip ahead
Examining technical chart formations, Ether is presently developing a rising wedge configuration, a pattern characterized by two upward-sloping trend lines gradually converging toward each other, while trading volume exhibits noticeable contraction.
Within technical analysis methodology, a rising wedge typically completes its formation when price action breaches the lower trend line in a downward direction and subsequently declines by a distance equivalent to the pattern's maximum vertical measurement.
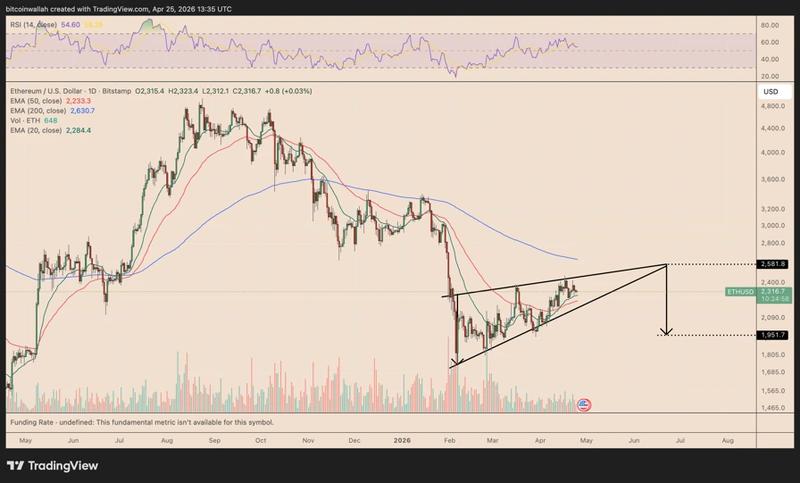
When this technical principle is applied to ETH's current price structure, the projected downside objective emerges at approximately $1,950, representing a decline exceeding 15%, with an anticipated timeframe extending into June, based on the assumption that the breakdown initiates at the wedge's apex near $2,580, the convergence point of the two defining trend lines.
Alternatively, should price action penetrate above the wedge's upper boundary line, the bearish scenario would be negated. Under such circumstances, bullish market participants might set their sights on the 200-day exponential moving average (200-day EMA, represented by the blue line) positioned around $2,630 as their subsequent upside objective.