ETH taker volume surges 72% as market eyes $2.6K liquidity zone
Strong buyer dominance emerges in ETH derivatives markets, with traders positioning for a critical rally toward the $2,500-$2,600 price range.

Futures contracts for Ether (ETH) on Binance have climbed to levels not witnessed in nearly two months as determined buyers entered the marketplace throughout the previous week. The volume of buy-taker activity surpassed $5 billion, with current market conditions indicating that the ETH price advance appears ready to persist.
Within a 24-hour period on Binance, the aggregate net taker volume reached $5.5 billion, representing a 72% increase from the $3.2 billion recorded earlier during the month. This particular metric monitors the differential between market purchase orders and market sell orders, revealing which side is controlling the price movement.
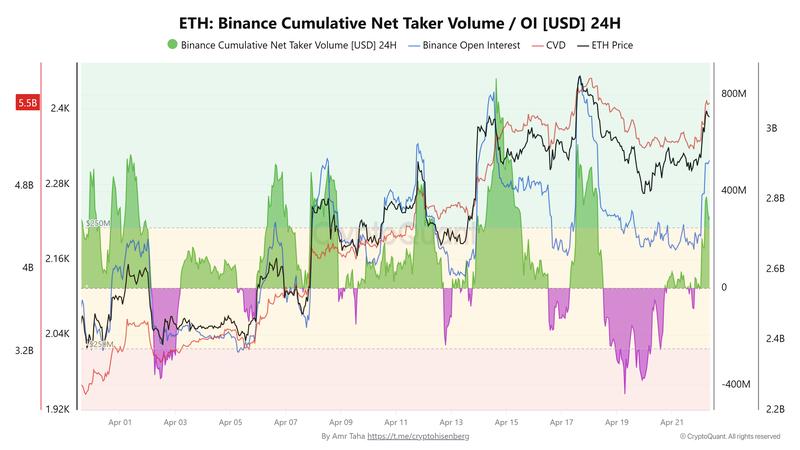
The rolling 30-day average has maintained positive territory since March 1, climbing back to levels previously observed in July 2022. These positive indicators demonstrate ongoing buyer aggression in the market.
According to crypto analyst Amr Taha, purchasing activity that surges in proximity to local price peaks indicates heightened conviction among market participants. When demand remains elevated in this manner, it frequently allows buyers to maintain control over near-term price trajectory.
Ether's $2,400 resistance encounters a liquidity gap
Currently, the ETH price is consolidating beneath the $2,400 threshold, a resistance point that has faced testing on three separate occasions since Feb. 6. With each successive rejection, the concentration of overhead sell orders has diminished. A decisive break above this price level would expose the $2,475–$2,634 range, an area where a daily fair-value gap exists.
This gap emerged during the sell-off in February and represents a zone where price action accelerated rapidly, creating unfilled orders in its wake. As momentum continues to develop, ETH's price could potentially return to these areas to achieve flow rebalancing.
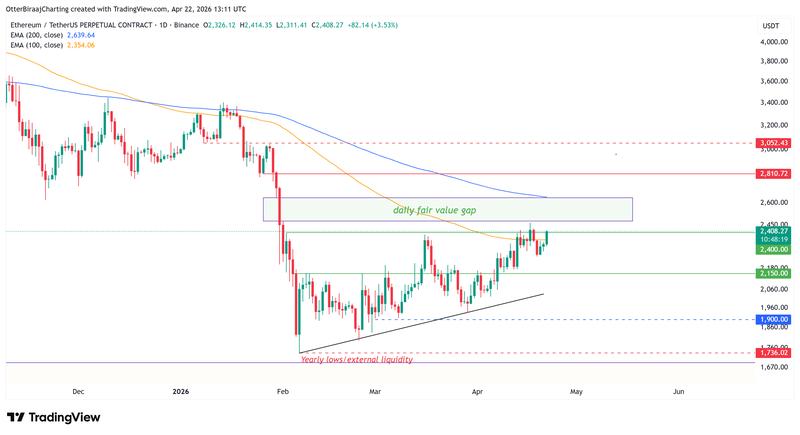
Additionally, Ether is working to recapture the 100-day exponential moving average (EMA), a threshold typically linked with trend-continuation phases. Maintaining stability above this particular trend line would strengthen the bullish rally. The 200-day EMA is gradually moving toward the upper boundary of the imbalance zone in the vicinity of $2,634, establishing a technical convergence with liquidity.
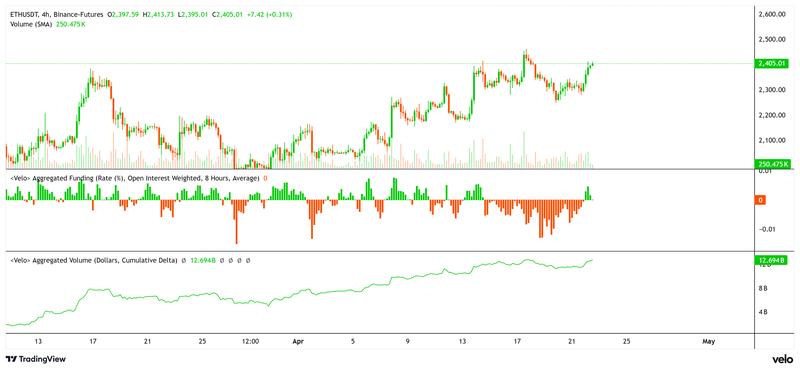
The positioning within derivatives markets provides additional context. The cumulative volume delta (CVD) for futures continues its ascent toward $12.6 billion, whereas funding rates stay close to neutral levels.
This suggests that leverage expansion has not occurred aggressively in tandem with price appreciation. The equilibrium between buyer demand and restrained leverage usage maintains focus on the $2,475–$2,634 zone as an immediate-term liquidity cluster of interest.