ETH Investors Return to Profitability While Price Charts Point Toward $3,000 Target
ETH holders have emerged from unrealized losses, boosting prospects for a climb to $3,000, though a significant resistance level at $2,800 could impede the upward trajectory.

The rally in Ether (ETH) to $2,390 on Monday elevated its price beyond the realized price level, suggesting that typical ETH holders have returned to profitable territory. The question remains whether this development provides sufficient momentum for bulls to push toward $3,000?
Key takeaways:
- ETH investors have returned to profitability, enhancing the potential for further gains.
- A bull flag formation on Ether's price chart indicates a $3,000 target.
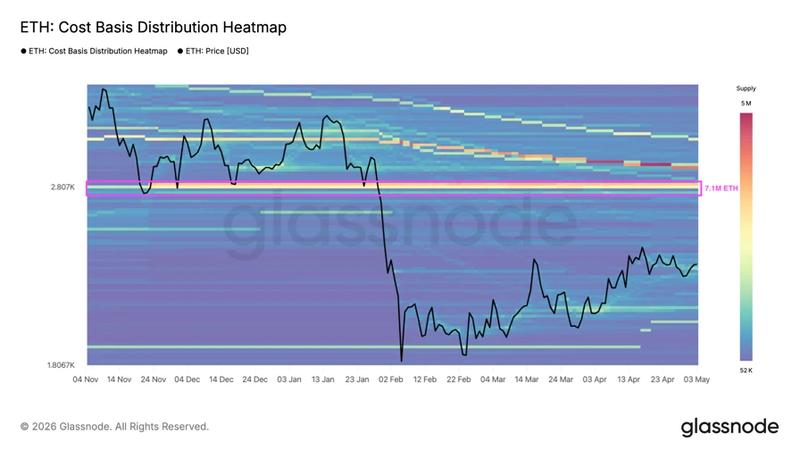
- Approximately 7.1 million ETH positioned around $2,800 represents a substantial potential resistance barrier.
Ether climbs above its realized price threshold
According to data sourced from TradingView, Ether's valuation climbed 21% to reach $2,340 on Monday, advancing from the local bottom of $1,940 recorded on March 29.
This upward movement has pushed ETH beyond its realized price level—representing the aggregate cost basis across all transferred ETH—which currently stands at $2,320, per Glassnode data.
The shift of the typical ETH investor back into profitable positions following a period of unrealized losses delivers significant psychological and financial relief to numerous holders, potentially fostering a more optimistic market outlook.
Based on historical patterns, surpassing this threshold typically transforms market psychology from fearful to greedy, diminishing selling pressure from investors holding losing positions. Such conditions frequently generate bullish momentum, drawing in fresh capital and triggering short squeezes.
Historical data illustrated in the chart below demonstrates that when Ether's price recovered above its realized price in May 2025 following approximately two months of trading beneath it, the cryptocurrency subsequently surged 173% from $1,800 to reach its $4,950 all-time peak. Similarly, ETH/USD recorded gains of 58% after reclaiming its cost basis in early 2023.
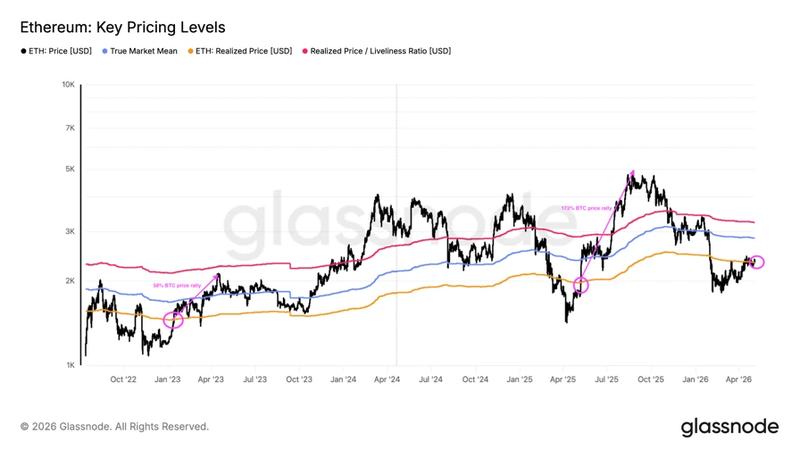
Consequently, maintaining price action above $2,300 becomes essential for bullish continuation and any potential challenge of the $3,000 level.
Market analyst Dami-Defi indicated that penetrating the $2,400-$2,600 range would catalyze the "most violent move of the year" pushing toward $3,000.
"Once we break $2,400 we will catapult violently to $2,800 - $3,000."
As previously documented by Cointelegraph, the ETH/USD trading pair needs to breach resistance positioned at $2,400 to validate a reversal in trend.
Technical analysis of ETH price: Bull flag pattern points to $3,000
The price movement of Ether has developed into a bull flag chart formation on the daily timeframe (illustrated below). Currently, the price is challenging the $2,350 resistance zone, a level where the upper boundary of the flag formation intersects with the 100-day exponential moving average (EMA).
Should a daily candlestick successfully close above this critical level, it would clear the path toward the pattern's measured objective at $3,018, representing approximately 30% upside from current price levels.
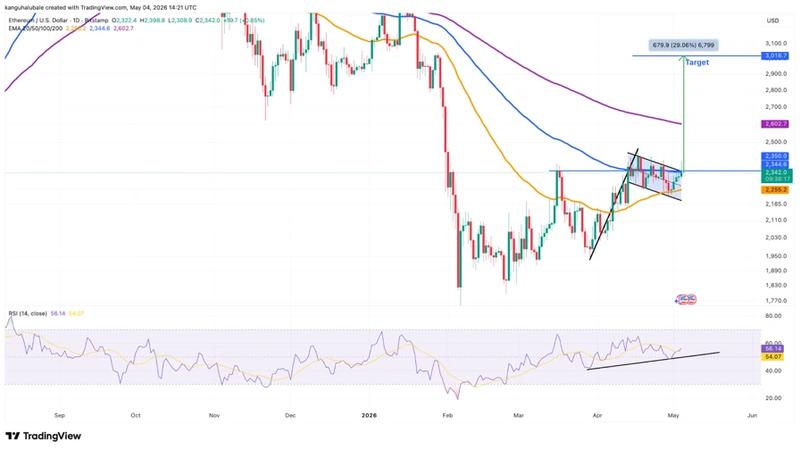
The relative strength index on the daily timeframe has advanced to 56 from conditions approaching oversold territory at 36 during late March, indicating that bullish participants are reentering the Ether market.
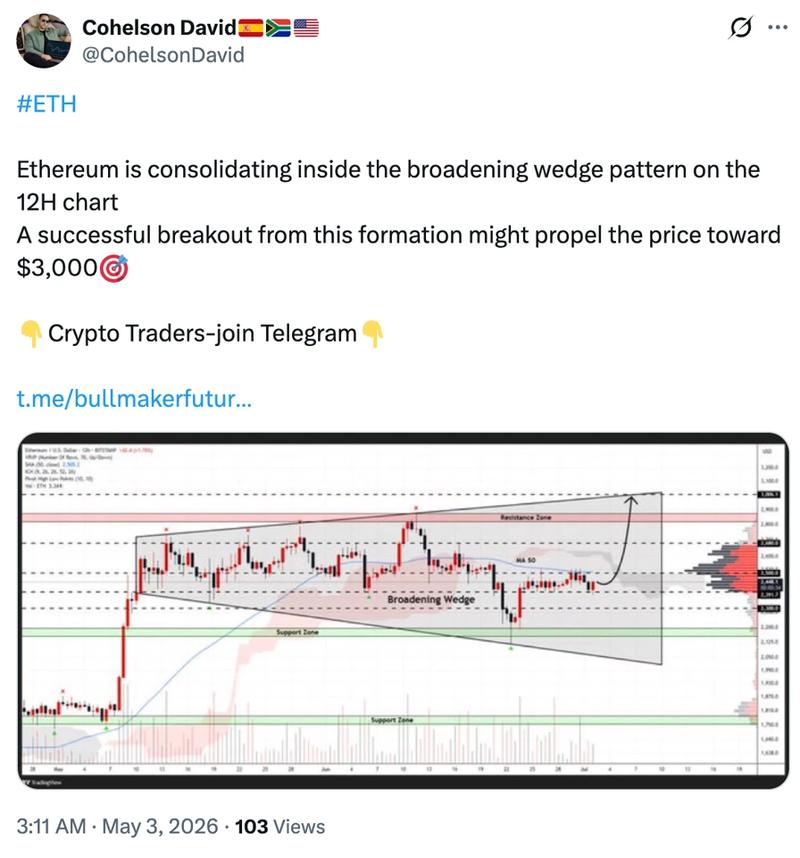
Market trader and analyst Cohelson David noted that a broadening wedge formation visible on the 12-hour chart suggests an ETH price breakout trajectory toward $3,000.
Nevertheless, examination of Ether's cost basis distribution reveals that approximately 7.1 million ETH is held by investors at an average acquisition cost ranging between $2,750 and $2,850, establishing a potentially significant resistance area.
This clustering of positions indicates that numerous market participants may elect to liquidate their holdings at breakeven prices, which could potentially halt Ether's upward progression.