ETH faces resistance at $2.4K with triple top formation raising bearish concerns
A concerning triple-top chart pattern emerges as Ether struggles to break through the $2,400 resistance level. Can bears continue dominating ETH's market movements?

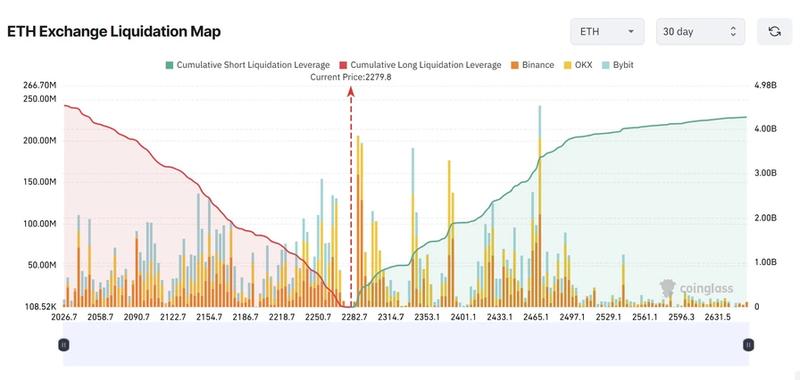
On Monday, Ether (ETH) experienced a decline of 3.4%, dropping to $2,287 following the fourth consecutive rejection at the $2,400 price point since April 14. Trading activity remains beneath the 100-day moving average, while approximately $2.5 billion in liquidation exposure clusters around the $2,150 support area.
Concerns about Ether's performance against Bitcoin were highlighted by crypto analyst Michaël van de Poppe, casting doubt on the potential for a robust near-term rally.
Multiple rejections at $2,400 limit ETH's upward momentum
Over the past two weeks, Ether has encountered resistance at $2,400 on four separate occasions, establishing a distinct triple top formation visible on the daily timeframe. With each subsequent attempt to breach that level, momentum weakened as sellers absorbed the buying pressure.
Acting as dynamic overhead resistance, the 100-day exponential moving average (EMA) positioned around $2,350 remains unchallenged. ETH has been unable to sustain trading above this threshold on the daily timeframe, resulting in brief and unsuccessful upward movements.
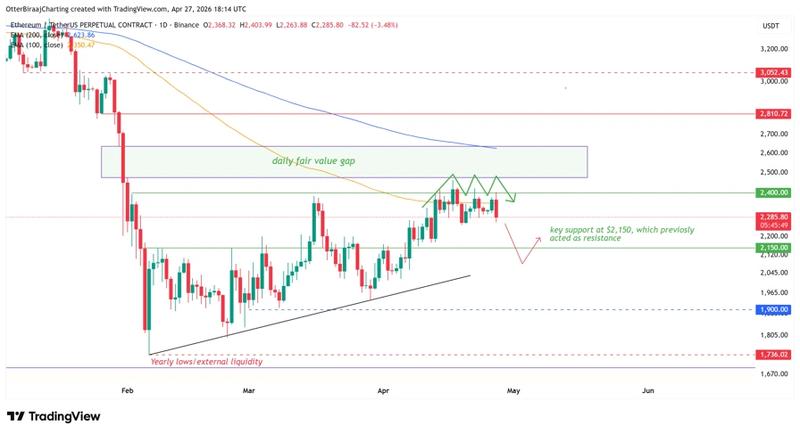
Attention has now shifted to the $2,150 support level, which holds increased significance. This price point previously functioned as resistance and may soon face testing as a foundational support in the near future. Should the price slip beneath this threshold, it would create opportunities for deeper downward movement.
Further complicating the situation at this zone, liquidation information reveals $2.5 billion worth of leveraged long positions positioned below $2,150. Breaking through this critical level could initiate cascading forced liquidations, potentially driving prices down into the $2,050 to $1,900 territory.
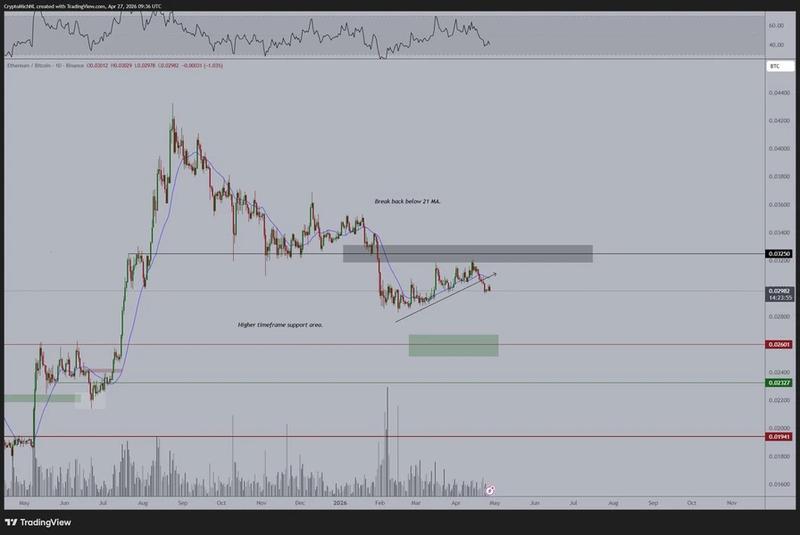
Michaël van de Poppe, founder of MN Capital, observed deteriorating strength in the ETH/BTC trading pair. The ratio declined beneath 0.032 BTC, eliminating an important support threshold that had previously underpinned continuation patterns.
Additionally, the ETH/BTC ratio fell below the 21-period moving average, indicating diminishing relative performance compared to Bitcoin. The subsequent higher-time frame support level exists around 0.026 BTC, a zone where purchasing activity previously emerged.
ETH futures activity suggests market repositioning
Ether's open interest (OI) on Binance has contracted to $2.58 billion, mirroring levels observed when ETH was trading around $2,200 earlier in the month. This reduction indicates a deleveraging event following the recent accumulation of speculative positions.
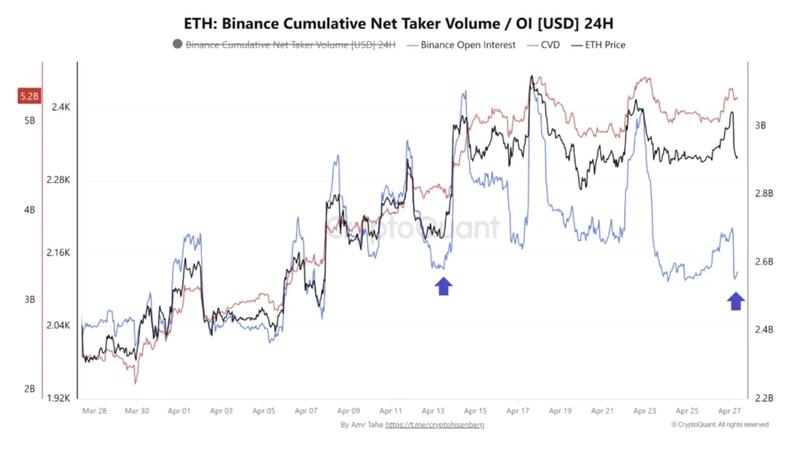
A more definitive indication comes from the funding rate, which currently stands near -0.013%, representing the lowest measurement recorded since February. Short positions are now dominating new market activity, while previously established long exposure has been systematically unwound.
According to crypto analyst Amr Taha, this configuration creates a situation where ETH exhibits a shorts-dominated environment with reduced overall leverage. Should the price maintain stability around current levels, the mismatch between market positioning and price action may intensify, potentially triggering a breakout movement earlier than market participants anticipate.
The critical focal point remains at $2,150, where liquidation vulnerabilities and the present technical support level intersect on the daily chart.