ETH Faces Growing Long Liquidation Threat as Price Slides Toward $2,100
Over $2.5 billion in long positions face liquidation if Ethereum falls below $2,000, with heightened volatility potentially pushing prices to test the $1,800 support level.

On Thursday, Ether (ETH) experienced downward price movement following an immediate market response to the previous day's United States interest rate announcement and projections indicating elevated inflation levels.
Key takeaways:
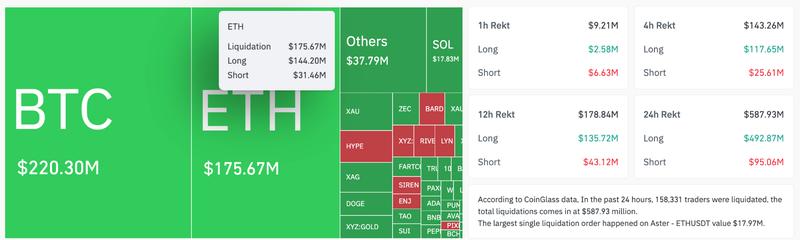
- ETH dropped 7% to $2,100 on Thursday, liquidating $144 million in longs.
- A break below $2,000 could trigger over $2.5 billion in additional long liquidations across exchanges.
- The 50-day moving average around $2,100 is a key level to watch.
Long liquidations of $2.5 billion at risk for Ether
According to TradingView data, ETH experienced 7% losses on a daily basis, with the ETH/USD trading pair falling to a low of $2,140 during Thursday's session.
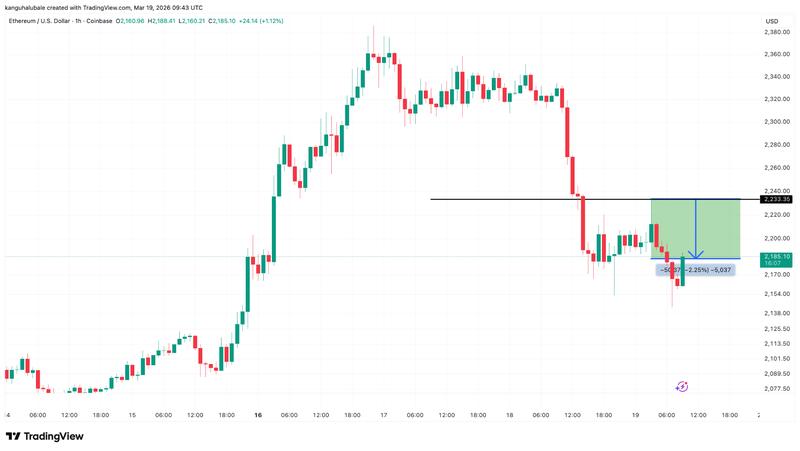
The price pullback in Ether has been paired with substantial liquidations of long positions throughout the cryptocurrency market, which reached a combined total of $492.8 million within the previous 24-hour period. As Ether descended to the $2,100 price point, more than $144 million worth of long ETH positions were forcibly closed.
This downward price movement took place even as Tom Lee's Bitmine Immersion Technologies acquired an additional 60,999-ETH, bringing their total holdings to approximately 4.6 million ETH, which represents roughly 3.81% of the entire supply.
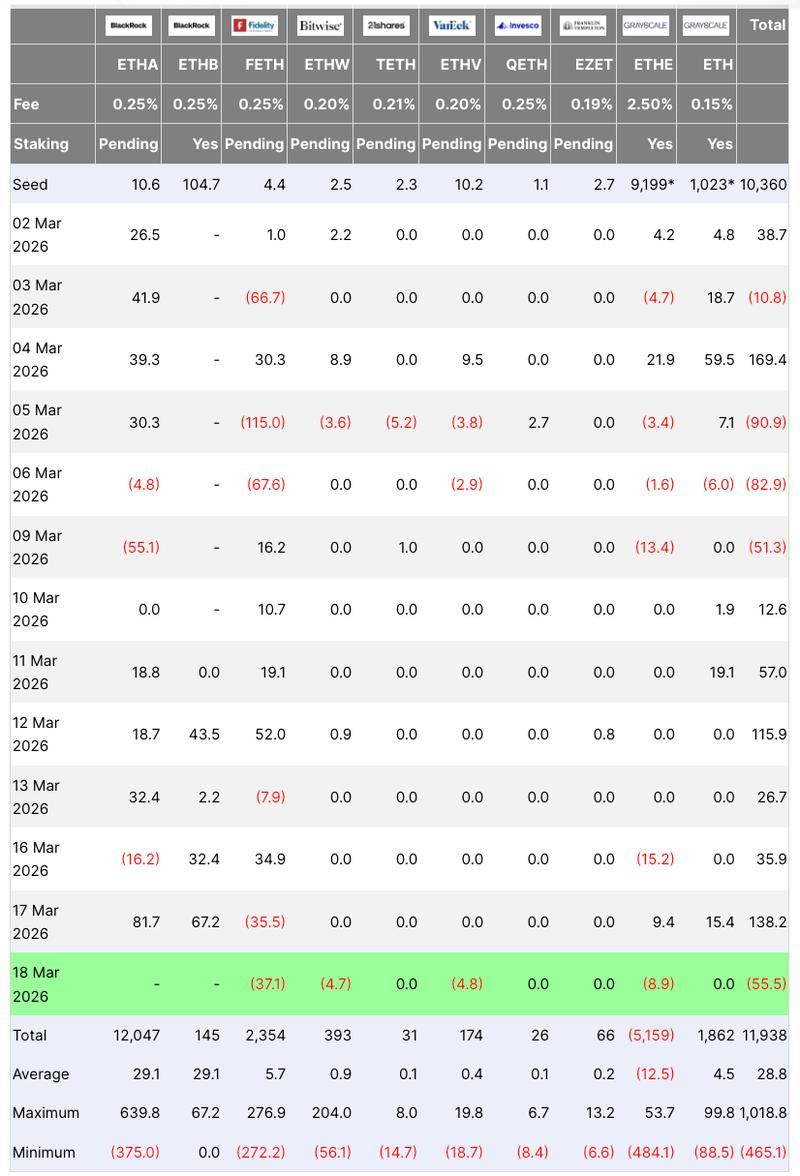
The decline in Ether's value occurred alongside renewed selling pressure in United States-based spot ETH exchange-traded funds (ETFs), which experienced net outflows exceeding $55.5 million on Wednesday, breaking a six-day streak of continuous inflows, based on data provided by Farside Investors.
The bearish momentum for Ether could intensify should spot market participants and institutional buyers fail to re-enter the market in the near term.
The potential for further Ether downside appears to depend on whether the critical $2,000 support level holds, given that a drop beneath this threshold would activate more than $2.5 billion in leveraged long position liquidations across all trading exchanges, according to CoinGlass data.
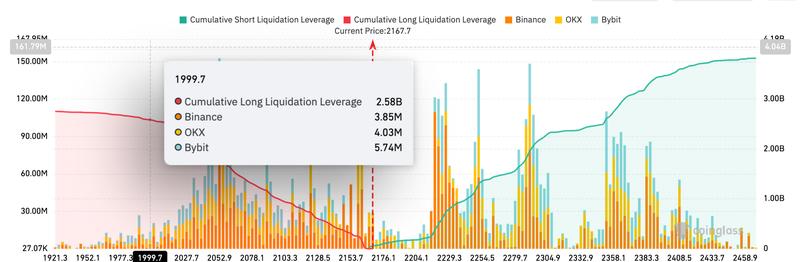
This indicates that a substantial volume of optimistic wagers would be eliminated during a downward price movement, creating conditions where ETH becomes susceptible to an even steeper decline should negative momentum gain traction.
FOMC risks continue to influence ETH price action
The bearish sentiment surrounding Ether today comes in the wake of the United States Federal Open Market Committee (FOMC) choosing to maintain interest rates at their current levels following the March 18 meeting.
The accompanying chart demonstrates that the ETH/USD pair has experienced declines following seven out of the most recent eight FOMC meetings, creating one of the most recognizable macro-driven patterns throughout its trading history.
A recurring pattern has emerged for ETH, characterized by price stabilization or upward movement in advance of the meeting, followed by sharp corrections immediately after the decision and related commentary are released to the public.
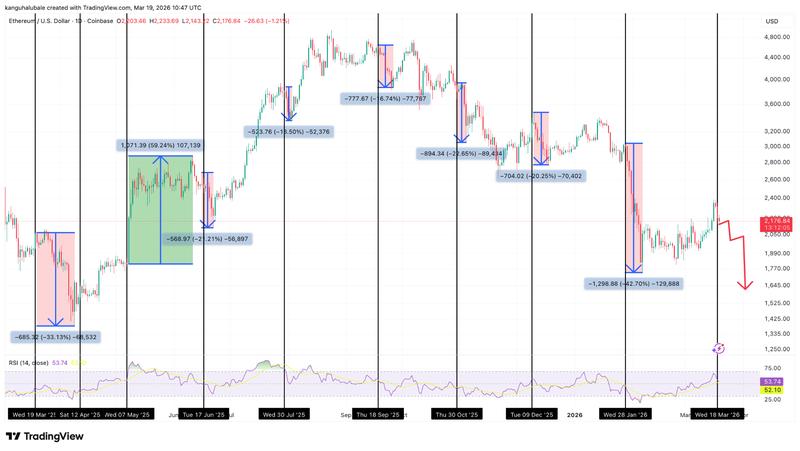
Standard post-FOMC price drawdowns have ranged from 16% to 23%, whereas more extensive deleveraging periods have resulted in ETH price decreases spanning 33%-43%.
From the standpoint of technical analysis, Ether maintains a cautiously optimistic outlook notwithstanding macroeconomic uncertainties. The asset is currently retesting a crucial support area in the vicinity of $2,100, which corresponds with the upper boundary of an ascending triangle pattern and the 50-day simple moving average (SMA).
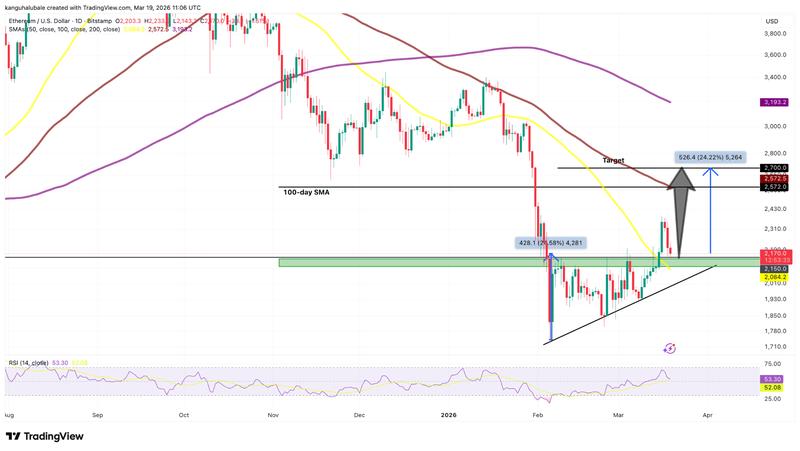
For buyers to regain control, they must successfully defend ETH above this critical price level. Successfully holding this support would clear the way toward the subsequent major resistance point at $2,575, the location of the 100-day SMA.
Beyond that threshold, the price has potential to advance toward the triangle's measured objective at $2,700, representing a 24% increase from the current price level.
On the other hand, an inability to maintain prices above $2,100 would undermine the bullish technical formation, driving ETH/USD back down toward the triangle's lower support boundary near $2,000, thereby jeopardizing the wider recovery trajectory.
According to previous reporting by Cointelegraph, a closing price below the 20-day exponential moving average in the vicinity of $2,000 would indicate that bearish forces have reasserted dominance, creating the risk of a more pronounced correction extending toward the subsequent major support zone around $1,800.
This article does not contain investment advice or recommendations. Every investment and trading move involves risk, and readers should conduct their own research when making a decision. While we strive to provide accurate and timely information, Cointelegraph does not guarantee the accuracy, completeness, or reliability of any information in this article. This article may contain forward-looking statements that are subject to risks and uncertainties. Cointelegraph will not be liable for any loss or damage arising from your reliance on this information.