ETH Dips Below $2,000 Mark: Large Holders Dump While Small Investors Stay Optimistic
Ethereum's price action reveals a critical breakdown from its dominant chart formation, pointing to potential further losses down to $1,750 even as retail traders maintain positive outlook.

Ether (ETH), the native cryptocurrency of the Ethereum network, dropped beneath the $2,000 threshold for the first time since March, yet individual investors haven't responded with fear-driven selling.
Key takeaways:
- Data from Ethereum's retail sector reveals increasing "buy the dip" mentality, potentially signaling additional downward pressure to come.
- Broader market indicators, including ETF capital flows and large holder activity, demonstrate institutional participants are offloading ETH.
Rising Retail FOMO Signals Potential for Additional ETH Decline
On Thursday, "buy the dip" messaging across social platforms experienced a surge following ETH's breach of the critical psychological threshold, based on information from data resource Santiment.
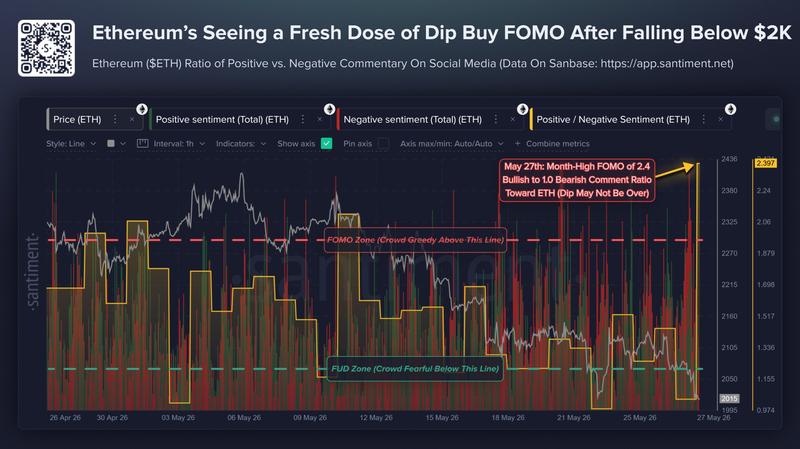
This indicates individual investors are viewing the price drop as a buying opportunity instead of recognizing it as a cautionary indicator.
Looking at historical patterns, when crowd optimism becomes excessive following a significant price decline, it frequently indicates additional downside is imminent, since retail trader sentiment typically reaches its peak prior to price finding stability. A more reliable contrarian buying opportunity may only materialize when FOMO subsides and fear-based selling dominates.
"There will be an opportunity to buy Ethereum, but ideally you will want to wait for the majority to cool down their FOMO and begin to show panic," Santiment said in a Thursday post, adding:
"This way, you will be buying while there is true blood in the streets."
Large Investor Selling Pressure Outweighs Retail Buying Enthusiasm
Major Ethereum holders seem to be taking the opposite position compared to retail investors attempting to buy the decline.
The endowment fund of Harvard University liquidated its complete $87 million ETH stake recently, and David Hoffman, co-founder of Bankless and a prominent Ethereum supporter, revealed that he had also disposed of his ETH holdings.
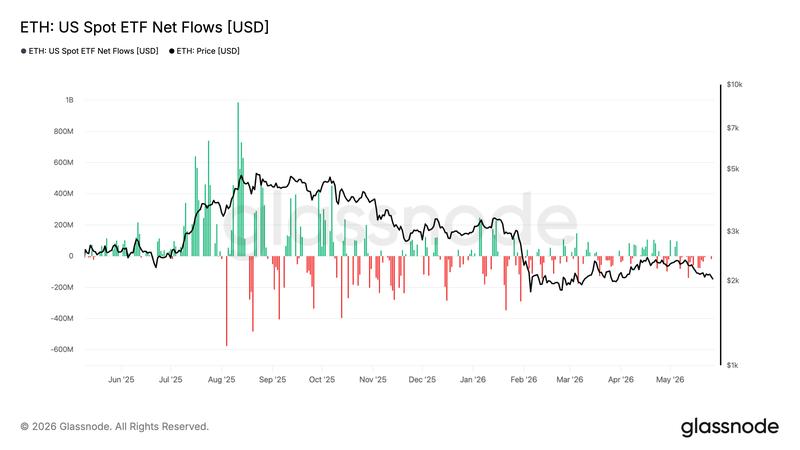
Spot Ether ETFs in the United States have experienced persistent outflows beginning May 7, with over $470 million in net withdrawals recorded during the previous two weeks.
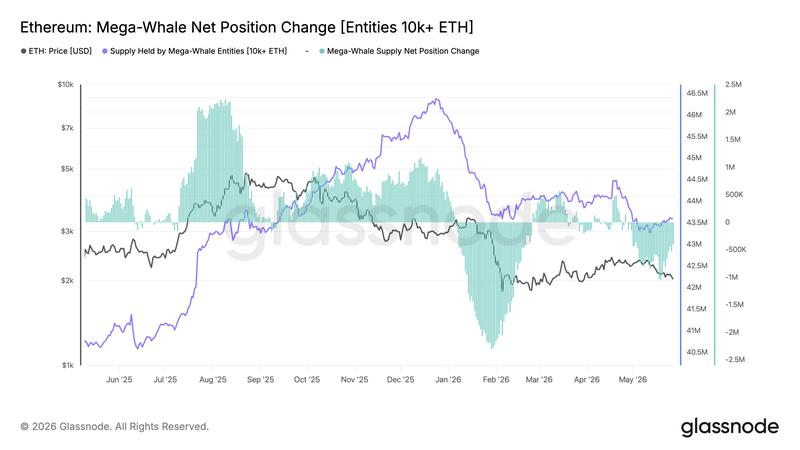
The largest Ethereum holders, defined as wallets controlling more than 10,000 ETH, are also decreasing their positions. Throughout 2026, these mega-whales have reduced their holdings by over 5%, based on data from Glassnode.
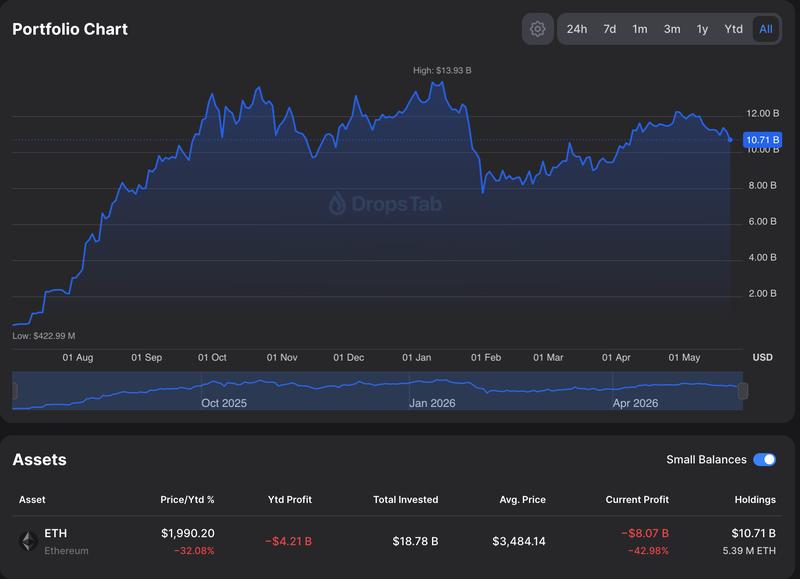
The primary exception remains Tom Lee's BitMine, which continues to hold approximately 5.21 million ETH, representing about 4.31% of total supply, as it pursues its objective of owning 5% of the network.
Lee has maintained that Ethereum is beginning a prolonged "supercycle" fueled by Wall Street's tokenization efforts and AI agents utilizing neutral public blockchain networks.
However, this position is now significantly unprofitable. BitMine's average acquisition price for ETH is approximately $3,484, whereas ETH currently trades at around $1,990, resulting in the company holding an estimated unrealized loss of $8.07 billion, based on data from DropStab.COM.
Ethereum Price Could Revisit the $1,750 Macro Support Level
On Thursday, ETH experienced an intraday decline of up to 3%, reaching approximately $1,965. This downturn also positioned Ethereum more than 40% below its 2026 peak near $3,400.
The most recent drop occurred after a breakdown from what technical analysts identified as a rising wedge, a chart pattern signaling bearish reversal characterized by two upward-sloping, converging trendlines.
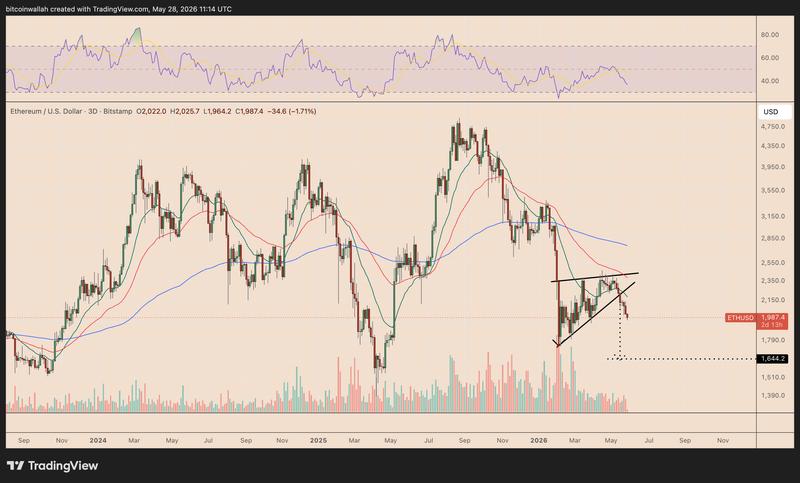
These formations generally resolve when the price breaches the lower supporting trendline, with the projected downside calculated by measuring the wedge's maximum height and subtracting it from the breakdown level.
ETH began its breakdown phase on Saturday and has continued declining since, bringing the calculated downside objective near $1,750 back into consideration, representing approximately 18.5% below current price levels.
In his Thursday post, analyst Ardi also projected $1,750 as the next ETH downside target.