Did Ethereum's 'ultrasound money' promise backfire? ETH plunges 65% relative to BTC post-transition
Since transitioning to Proof-of-Stake, Ethereum has struggled to maintain deflationary status, leaving ETH holders disappointed with its performance, especially when measured against Bitcoin.

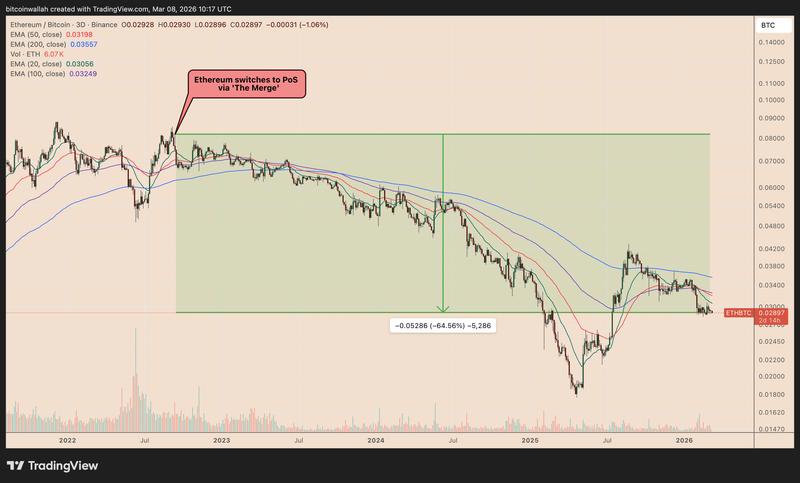
Since Ethereum made its 2022 transition to Proof-of-Stake (PoS), Ether (ETH) has experienced approximately a 65% decline relative to Bitcoin (BTC), raising serious questions about the validity of the network's "ultrasound money" concept.
Key takeaways:
- The expansion of L2 solutions and declining fee levels have undermined Ethereum's "ultrasound money" deflationary narrative.
- ETH has underperformed relative to BTC as market participants place greater confidence in Bitcoin's predetermined supply mechanism.
The ultrasound money concept fails to deliver for Ether
The fundamental concept underpinning "ultrasound money" posited that Ether would achieve greater scarcity than Bitcoin itself.
Proponents maintained that the 2021 implementation of Ethereum's EIP-1559 upgrade, which initiated the burning of a percentage of transaction fees, when coupled with the dramatic reduction in new ETH creation after the 2022 Merge, would establish Ether as deflationary in the long run.
Following the activation of the burn mechanism in 2021, ETH's new annual supply rate has maintained an average of approximately -0.19%, based on data from Ultrasound.MONEY.
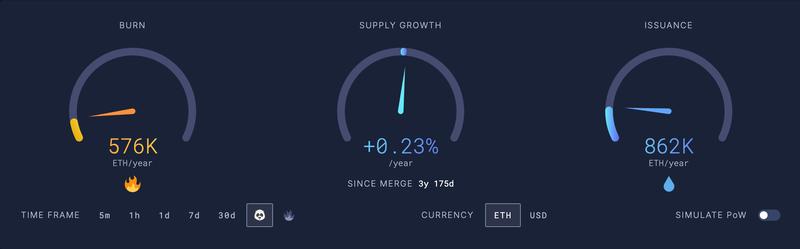
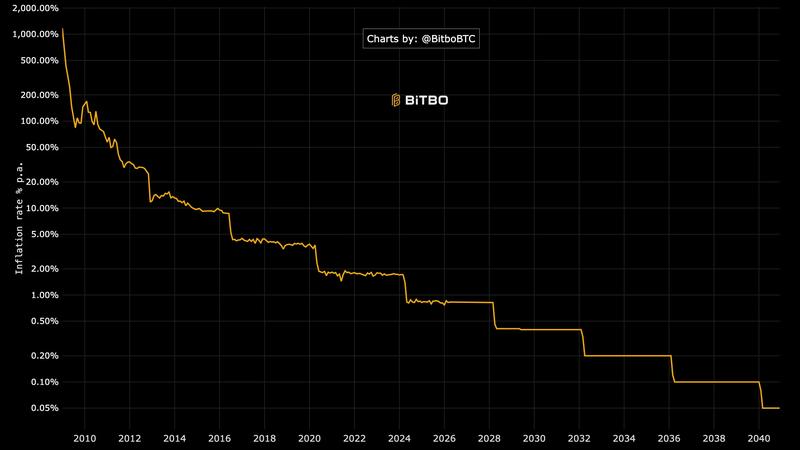
Despite this, following Ethereum's PoS transition in 2022, ETH supply has experienced growth at an annualized pace of approximately 0.23%, although this remains below Bitcoin's present annual inflation rate of 0.85%.
Yet Ethereum's supply expansion following the Merge contradicts the deflationary pledges. ETH achieves deflationary status exclusively when activity on the mainnet reaches levels sufficient to burn a greater quantity of coins than the network distributes to validators.
This requirement has deteriorated. In March, Ethereum's average transaction fee stands at approximately $0.21, representing a decline of roughly 54% compared to the previous year, based on YCharts data.
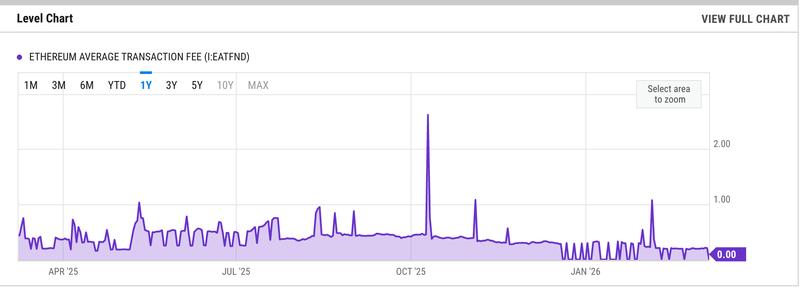
Reduced fee levels translate to diminished ETH burn rates on the Ethereum network.
Furthermore, the majority of Ethereum's transaction activity has migrated to more economical layer-2 solutions. Data from L2beat indicates that rollups processed 926 user operations per second (UOPS) on March 7, in stark contrast to merely 22.36 on Ethereum's mainnet.
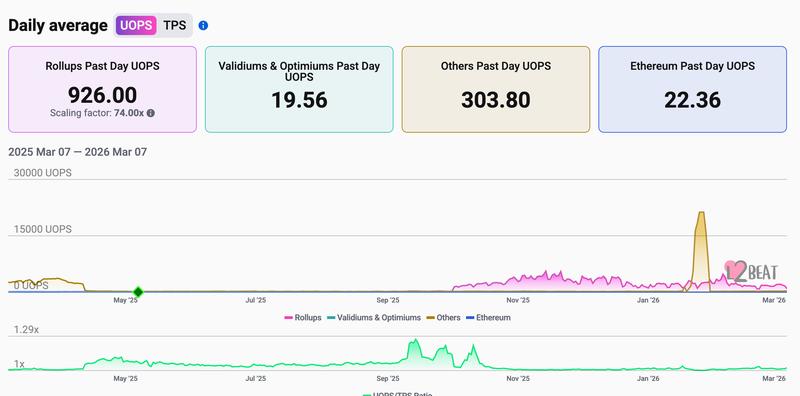
Although this migration supports the network's scaling objectives, it diminishes the high-burn environment necessary to establish Ethereum as deflationary.
What explains ETH's weak performance against BTC?
The price of Ether has lagged behind BTC in part due to investor confidence in Bitcoin's predetermined supply, according to analyst Handre.
Bitcoin's rigidly enforced cap of 21 million coins and predetermined supply schedule attract investors by providing greater long-term predictability for BTC. This unwillingness to implement changes distinguishes Bitcoin from the monetary frameworks governing most alternative cryptocurrencies.
"Every scaling debate, every upgrade proposal, every attempt to change Bitcoin's monetary policy has failed because the economic majority understands what they're protecting," Handre said.
Conversely, Ethereum exhibits less predictability regarding its monetary policy, especially given that ETH supply has returned to modest growth.
Handre added:
"Every altcoin promises scarcity but delivers inflation by design. Ethereum abandoned its 'ultrasound money' narrative the moment it became inconvenient."
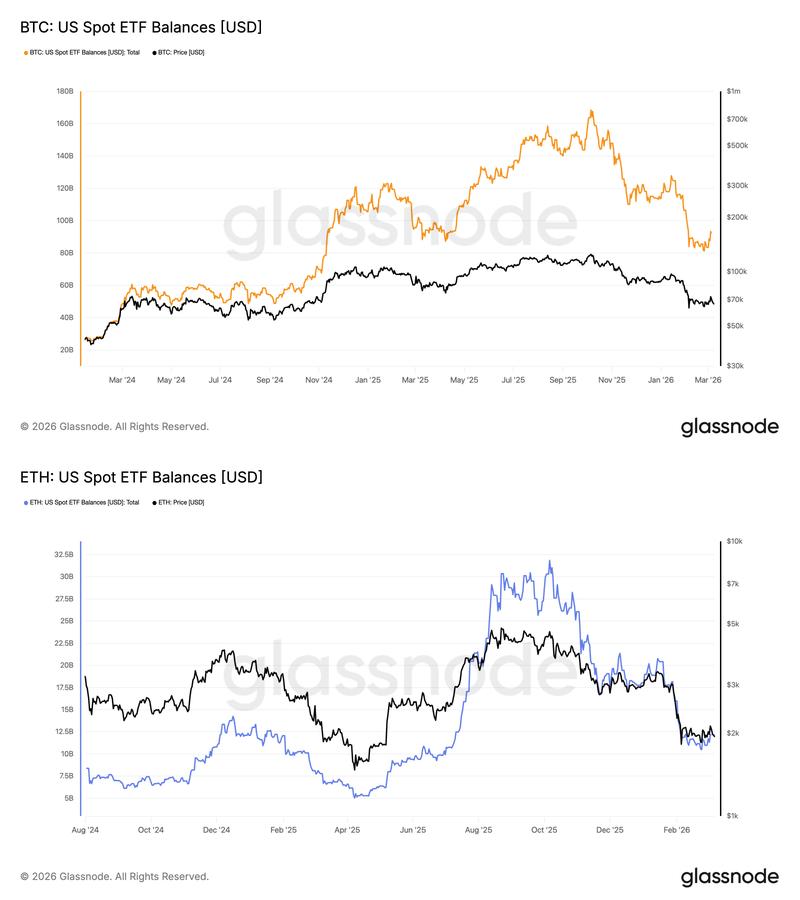
This investor preference is evident within the United States' ETF marketplace. Through March, spot Bitcoin ETFs have accumulated in excess of $91.9 billion in assets under management, while spot Ethereum ETFs hold approximately $12.1 billion.
Ether has also failed to produce a persuasive breakout when valued in dollar terms.
Throughout the period spanning 2021 to 2026, ETH achieved only a modest advance beyond its prior all-time high around $4,800 before experiencing a loss of upward momentum, contrasting sharply with Bitcoin, which saw its price appreciate by double from the 2021 peak to reach the 2025 record high.
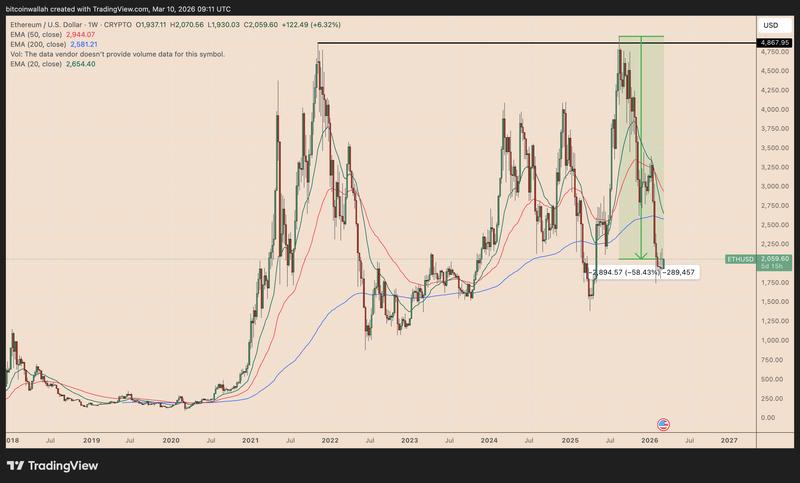
ETH's lackluster performance throughout the preceding five years indicates that decreased issuance by itself proved insufficient to generate consistent new demand.
Market sentiment has additionally faced pressure from sporadic ETH sales associated with Vitalik Buterin and the Ethereum Foundation.
Public commentary from Culper Research, which disclosed a short position on Ether citing Buterin's selling activity, has reinforced the perception among certain traders that Ethereum's core participants are offloading holdings during price strength instead of demonstrating enduring commitment.