Data Points to Ethereum as Strong Long-Term Investment Despite 2026 Decline: Analyst
Despite ETH's 28% decline in 2026, Ethereum's market leadership in DeFi, stablecoins, and staking continues to bolster the case for long-term accumulation, according to on-chain data.

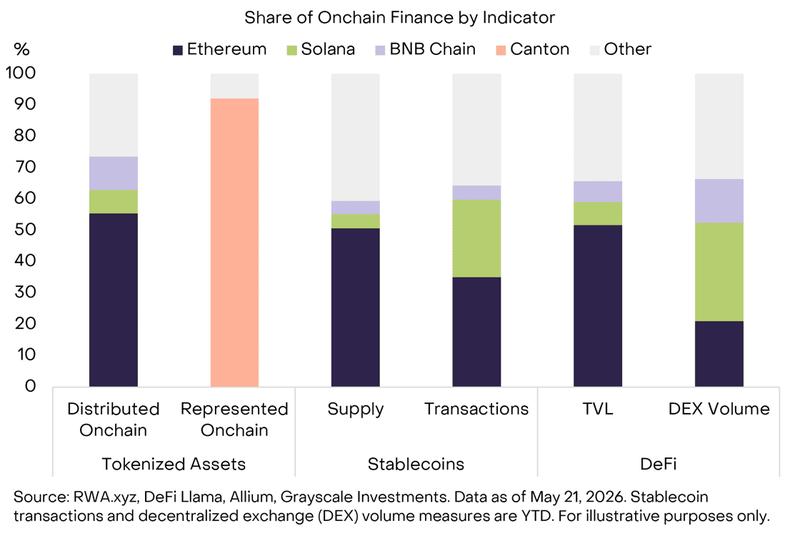
Despite a significant 28% drop in value throughout this year, Ether's (ETH) prospects as a long-term investment opportunity are gaining renewed focus as Ethereum maintains its position at the forefront of critical sectors within onchain activity and decentralized finance. The blockchain network continues to dominate with approximately $43 billion in DeFi liquidity, over $165 billion worth of stablecoins, and close to 55% of all tokenized assets monitored across public blockchain networks.
According to information from Token Terminal, the total market capitalization of tokenized exchange-traded funds (ETFs) has surpassed $400 million, with Ethereum commanding a dominant 76.9% share of this market segment.
Citing the information mentioned above, cryptocurrency analyst Tanaka stated,
These are the pieces I believe will continue to lead the market in the mid to long term. And if we look at the current data, Ethereum is still the most important settlement layer for these narratives.
Despite the substantial 28% price decline experienced in 2026, Ethereum staking activity has maintained its upward trajectory. Network statistics revealed that staked ETH volumes reached approximately 39.1 million coins, representing roughly 32% of the complete ETH supply, distributed among more than 896,000 validators currently active on the network.
Demand from validators seeking entry has also stayed at elevated levels, with more than 3.49 million ETH currently waiting in the queue for staking entry, creating a waiting period exceeding 60 days, whereas the exit supply continues to remain minimal at just 7,424.
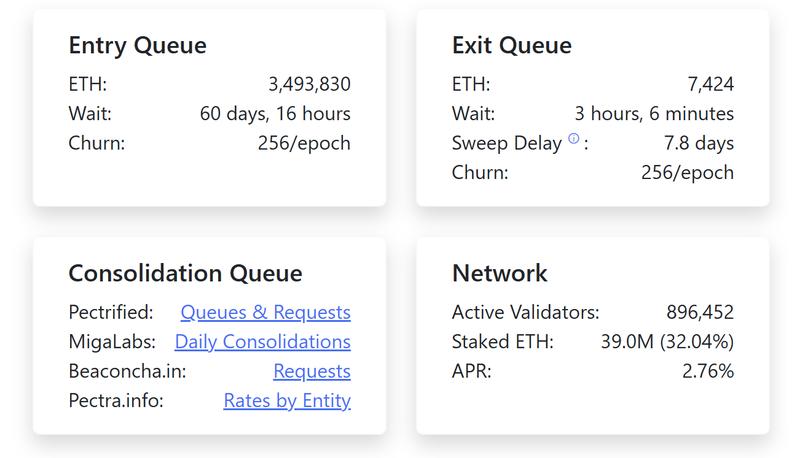
The significance of the lengthy validator queue lies in its demonstration that substantial quantities of ETH are continuing to flow into staking arrangements despite the weaker price performance observed throughout this year.
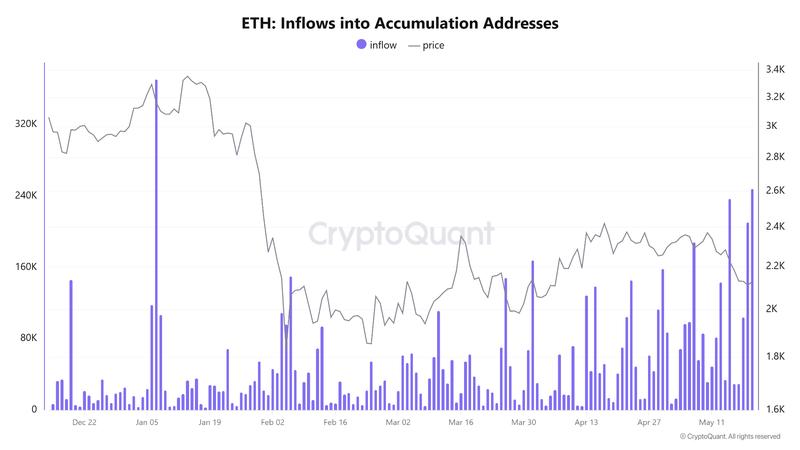
Additional information from CryptoQuant also emphasizes an emerging Ether accumulation pattern. On May 20, ETH inflows into accumulation addresses hit 248,400 ETH, representing the most robust single-day inflow recorded since Jan. 6. These particular wallets are frequently linked with long-term holding strategies, given their pattern of limited selling behavior.
Analysts monitoring ETH's historical buying opportunity zone
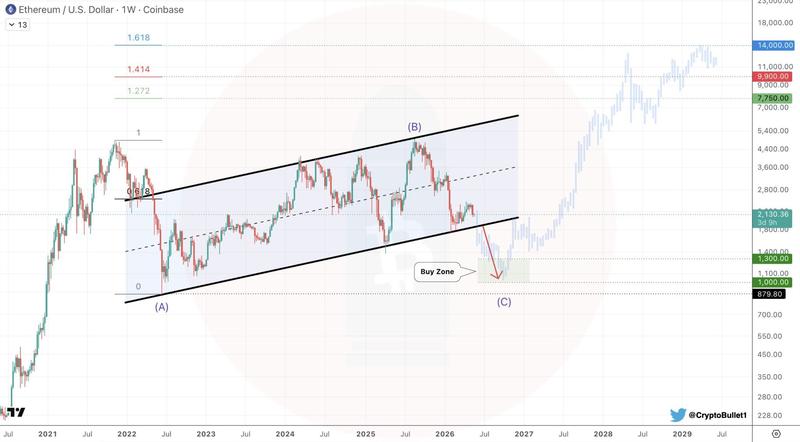
According to trader Crypto Bullet, the weekly chart for Ether continues to display a multi-year accumulation range spanning between $1,000 and $5,000. This analyst interprets the preceding several years as a timeframe during which market participants gradually constructed their positions in anticipation of a more significant trend emergence.
According to Crypto Bullet's analysis, ETH may still return to the $1,000 to $1,300 price area, characterizing it as a potential final capitulation zone preceding the next cycle's expansion phase. The analyst has additionally outlined long-term price targets on the upside ranging from $7,700 to $14,000 for the timeframe spanning 2027 through 2029.
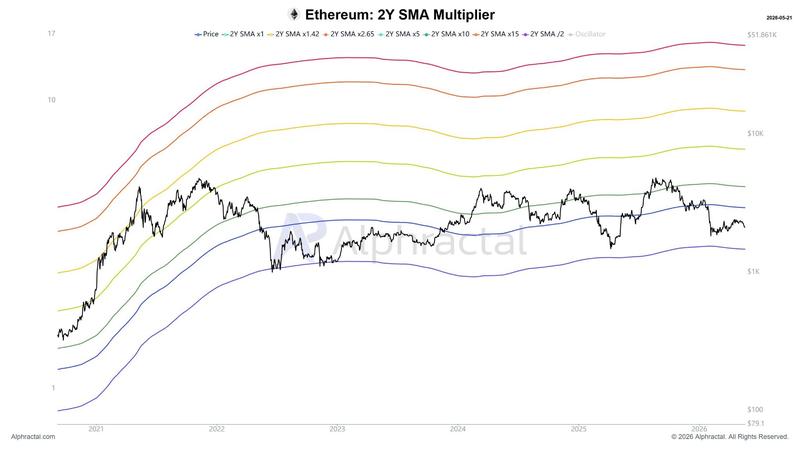
Onchain analyst Rei drew attention to Ether's current position within the two-year simple moving average multiplier model developed by Alphractal. This model creates a comparison between ETH's current price and its average price over the preceding two-year period to identify phases when ETH has traded either above or below its historical average.
In recent trading, Ethereum has fallen beneath the chart's two-year SMA x1 band, representing the baseline average price for ETH throughout the past two years. Market participants commonly interpret the x1 level as representing a fair-value zone under normal market circumstances.
Upper bands such as x1.42 and x2.65 have historically emerged during overheated phases within bull market cycles when ETH has traded significantly above its long-term average price.
The current price is now approaching closer to the lower 2Y SMA/2 band, displayed in purple on the analytical chart. According to Rei's statement,
History shows that whenever $ETH approaches or touches this zone (like in late 2022), the market usually establishes a highly reliable, cyclical "accumulation zone."