Could XRP Experience a 20% Price Surge This March?
Technical chart formations pointing to bullish reversal combined with declining whale sell-offs could drive XRP prices upward by 20% or beyond during March.

XRP (XRP) has experienced a decline exceeding 50% from its October 2025 peak, marking five straight months of negative price action. Could the month of March finally break this downward trend?
Key takeaways:
- A double-bottom formation on XRP charts suggests a potential 20% gain during March.
- Large holder distribution has diminished while whale balances show growth, strengthening bullish prospects.
Double bottom formation suggests potential 20% XRP surge
By Thursday's close, XRP appeared to be developing a classic double bottom chart pattern following two successful tests of the $1.30–$1.35 support zone during February.
This pattern emerges when an asset's price reaches an identical low point on two separate occasions before bouncing back. The pattern completes upon a breakout beyond its neckline, typically establishing an upward price objective equivalent to the pattern's depth measured from the breakout point.
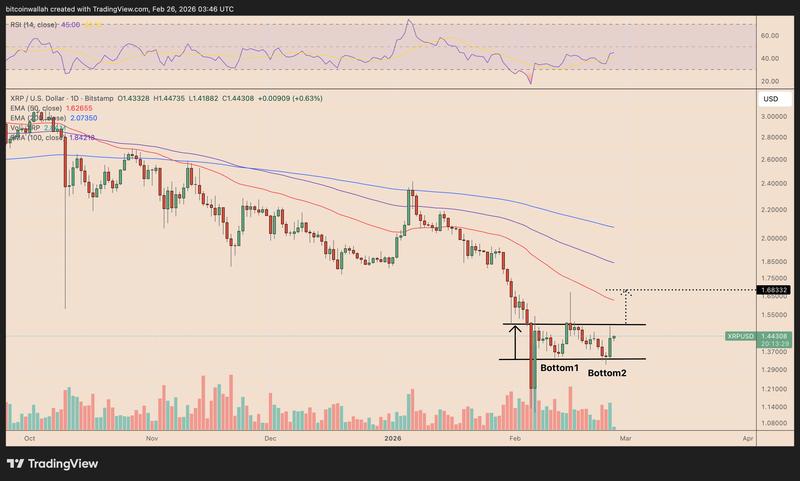
In XRP's case, the pattern's neckline resistance sits approximately at $1.50. A confirmed breakout beyond this threshold would elevate the probability of XRP climbing toward $1.68–$1.70 before March concludes, representing roughly 20% gains from present price levels.
Improved XRP whale activity strengthens recovery prospects
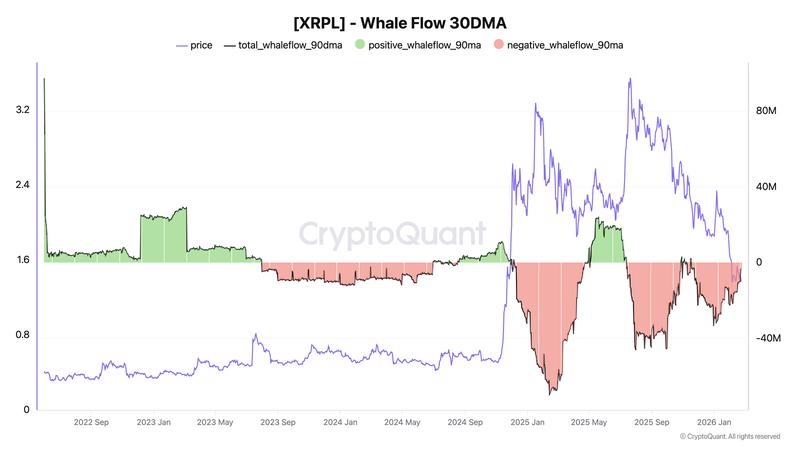
Network flow data indicates XRP net flows are trending toward neutral territory following an extended distribution period, based on analytics from data provider CryptoQuant.
By Thursday's assessment, aggregate whale flow measured on a 90-day moving average stood at approximately -3.29 million XRP versus about -33.50 million XRP recorded in December. This demonstrates that large holder outflows have declined significantly despite XRP experiencing a 25% price decline during this same timeframe.
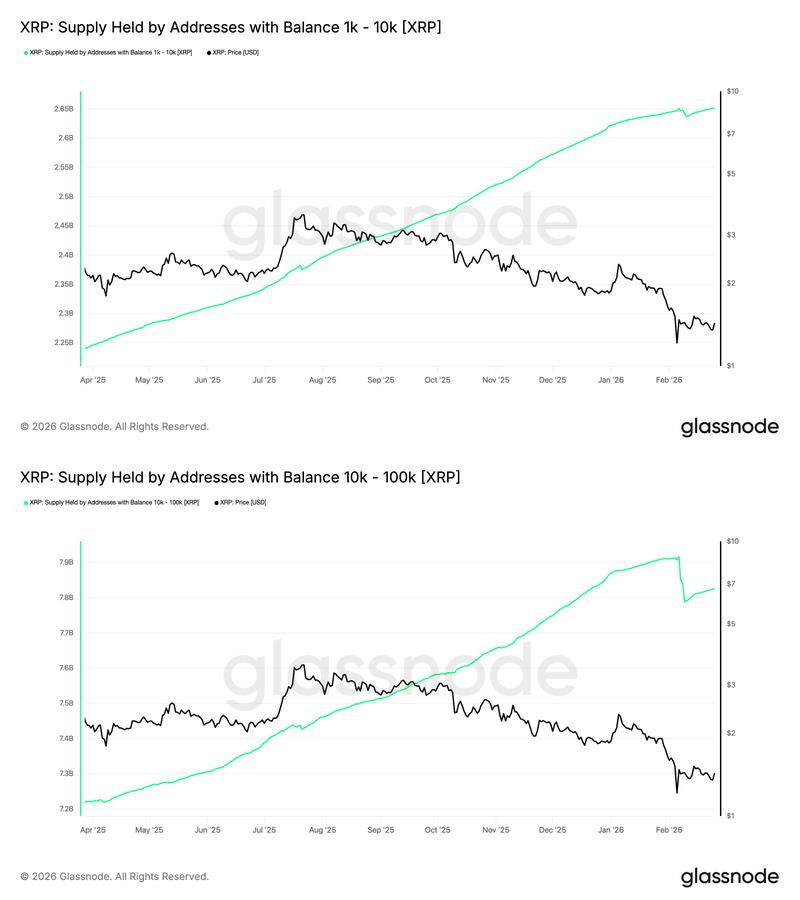
Simultaneously, the amount of XRP held in wallets containing a minimum of 1,000 tokens has begun climbing again in recent weeks, indicating that large holders have ceased their selling pressure and could be accumulating positions near current price lows.
Comparable improvement in whale flow metrics was observed during April 2025, which came before an XRP price recovery exceeding 50%.
Consequently, a clear transition above the zero threshold would indicate net buying activity and bolster the argument for XRP to advance toward its $1.68–$1.70 double-bottom price objective during March.
What factors could derail the positive XRP outlook?
The projected $1.68–$1.70 price zone lies beyond XRP's 50-day exponential moving average (50-day EMA, the red trendline), a resistance level that price action has been unable to penetrate throughout the month of February.
A rejection at the 50-day EMA resistance could prevent XRP from achieving its double-bottom price target. Such a development might additionally activate a bear pennant formation scenario targeting approximately $1, representing about 30% downside from current trading levels.
Broader market uncertainties present additional challenges. The resurgence of artificial intelligence-driven risk aversion alongside escalating US–Iran geopolitical tensions could withdraw liquidity from higher-risk cryptocurrency assets, complicating XRP's ability to maintain upward momentum even when technical chart patterns currently appear favorable.