BTC's surge past $81K divides market: Is this a supercycle beginning or temporary bear rally?
Market participants increasingly call the bottom as price projections reach $180,000–$250,000 over the next 12 months, sparking intense debate about whether Bitcoin's broader bull market has returned.

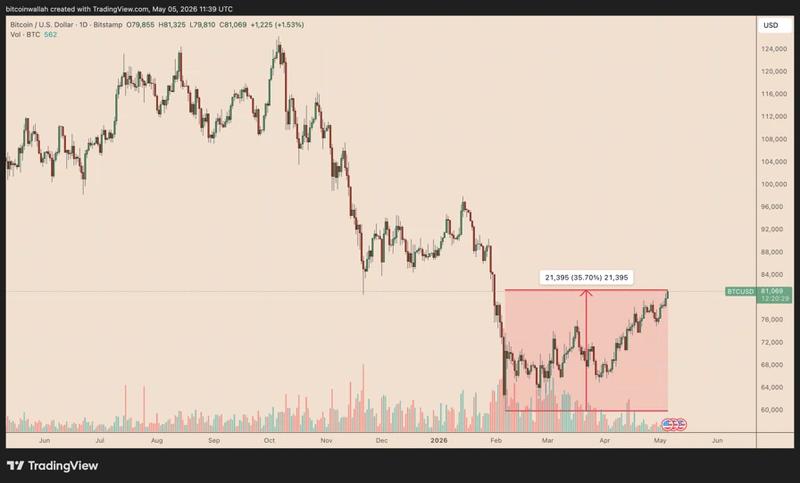
Bitcoin (BTC) posted a 3.5% gain this week, reaching $81,325 on Tuesday—marking its strongest performance since January. The question dividing traders now is whether this represents merely a temporary bounce within an extended bear market, or if Bitcoin has already established a bottom and resumed what some are calling a "supercycle."
Key takeaways:
- Bitcoin could potentially surge to $180,000–$200,000 driven by institutional buying that counterbalances bearish forces
- Significant resistance persists in the $80,000–$82,000 price zone.
$250,000 target emerges from Bitcoin "supercycle" framework
The current Bitcoin recovery has reached 35.70% measured from the February bottom of $59,930. However, BTC continues trading approximately 36% beneath its October 2025 peak near $126,200. This positioning has ignited considerable disagreement among market participants, with certain analysts forecasting a climb to fresh all-time highs before year-end.
According to analyst PlanC, Bitcoin isn't following a conventional boom-bust pattern but instead entering its inaugural "supercycle."
Through a Tuesday analysis, he outlined expectations for a climb exceeding $250,000 during 2027–2028, measured from the November 2022 bear-market bottom at $16,000.
His analytical model divides the present cycle into three distinct stages: an opening surge to $126,000 (now complete), a mid-cycle pullback approaching $60,000 (also finished), and a concluding expansion stage aimed at fresh peaks above $250,000.
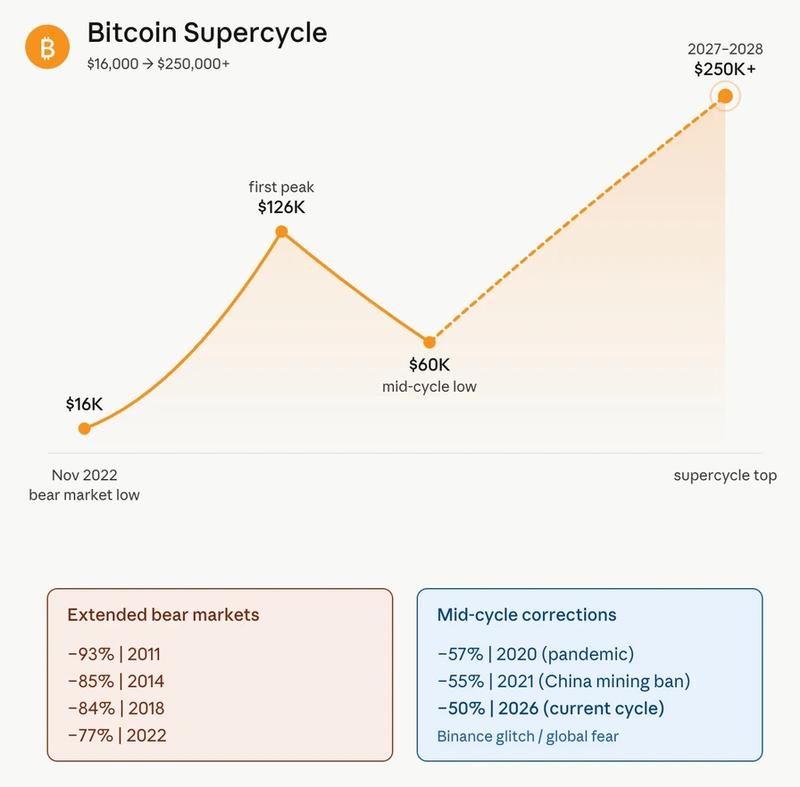
The critical difference, according to his assessment, is that this latest ~50% decline mirrors previous mid-cycle adjustments observed in 2020 and 2021, unlike the more severe 70%–90% bear markets witnessed in 2014, 2018, and 2022.
Under current market conditions, institutional purchasing is consuming more than 500% of the fresh daily BTC issuance, transforming what would be steep declines into milder corrections.
Nevertheless, this theoretical framework depends on Bitcoin maintaining levels above its mid-cycle support around $60,000. Any drop beneath this threshold would negate the supercycle hypothesis and revive the possibility of an extended bearish period.
"I think once BTC clears the mid 80's and holds the chances of seeing new highs are quite high," analyst Pentoshi said in a Tuesday post, citing the ongoing supply squeeze.
He added:
In terms of probabilities, I think the lows are in and we could see BTC trade as high as $180k between this year and next.
Elliott Wave analysis suggests Bitcoin has established its bottom
The recent Bitcoin recovery has bolstered arguments that its correction phase from the January 2025 peak has concluded, based on trader Decode's Elliott Wave technical framework.
The analysis indicates BTC has probably finished a three-segment A-B-C corrective pattern, with the terminal "C" wave finding support around $60,000. According to Elliott Wave principles, this configuration typically signals the conclusion of a corrective sequence and may introduce a fresh five-wave upward movement.
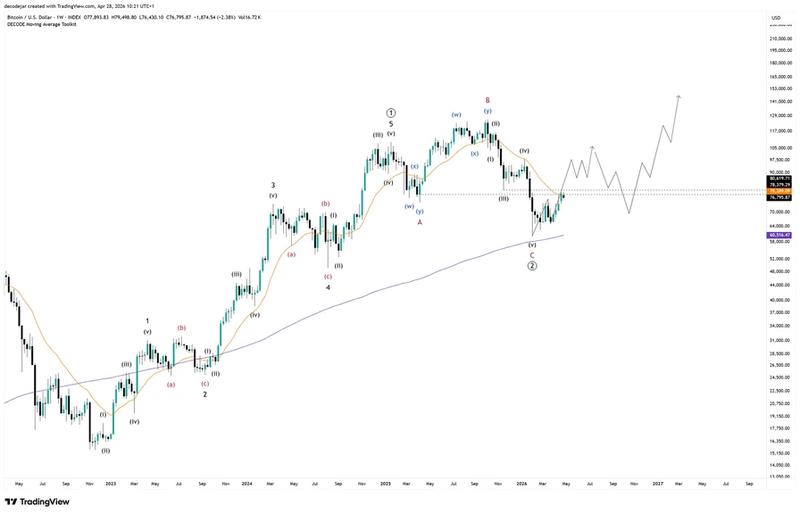
Decode highlights that Bitcoin has successfully reclaimed territory above its November bottom, albeit marginally. This price overlap negates pessimistic wave interpretations anticipating "one more low" as part of the same descending impulse pattern.
Consequently, the bearish scenario has become more limited. While BTC might still be operating within a broader corrective structure, the more straightforward interpretation now points to the recent $60,000 zone representing a probable cycle bottom.
A conclusive recovery and hold of the $78,000–$80,000 band as foundational support would strengthen prospects for a BTC price advance toward $90,000–$100,000 in subsequent trading.
Key resistance zone attracts selling pressure
Bitcoin's upward momentum is encountering a well-established resistance area, elevating the possibility of near-term retracement.
As of Tuesday, BTC faces a convergence of its 200-day exponential moving average (200-day EMA, the blue line) alongside the top boundary of a bear flag formation around the $80,000–$82,000 territory.
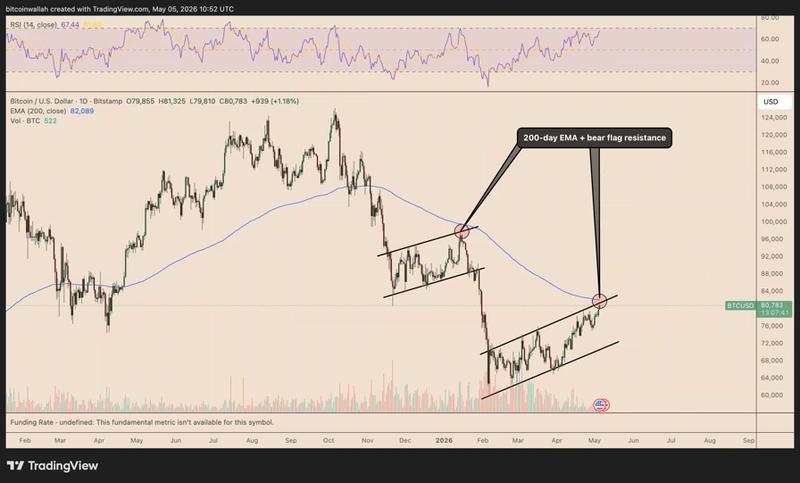
This confluence of resistance factors enhances the probability of a Bitcoin retreat over the next several days, with potential downside objectives located near the flag pattern's lower boundary around the $70,000–$72,000 zone.
A decisive breakdown beneath the bear flag's lower support line creates risk for price movement below $50,000.
An analogous pattern unfolded during January, when Bitcoin advanced into its 200-day EMA following an extended downtrend but couldn't achieve a breakout. The subsequent rejection initiated another downward phase before a more sustainable bottom ultimately developed.
Furthermore, the 200-day EMA has functioned as formidable resistance during Bitcoin's bear market recoveries historically, especially throughout 2018 and 2022, as demonstrated in the chart presented by analyst Jason Pizzino.

Following tests of the 200-day EMA as resistance throughout the 2018 bear market, BTC's price fell an average of 40%. During 2022, the typical drawdown measured approximately 35.5%.
Should this historical pattern repeat itself, BTC price could potentially retreat into the $48,000–$52,000 range, which corresponds with the bear flag's projected downside target.