BTC's struggle around $70K level suggests market may face further downside
Bitcoin's decline beneath the $70,000 threshold shows weakness, though technical patterns on shorter timeframes suggest potential for a quick recovery.

The price of Bitcoin (BTC) fell beneath the $69,000 mark on Thursday, sending it back into the six-week trading range it had occupied before briefly breaking out to highs above $76,000 just days earlier.
This decline comes alongside heightened selling activity in Bitcoin futures markets and weakening appetite from investors based in the United States, though there remains opportunity for a recovery bounce. A repeating technical chart formation suggests that BTC has the potential to resume its upward trajectory provided that certain conditions are satisfied.
Bitcoin derivatives lead price action as spot buying weakens
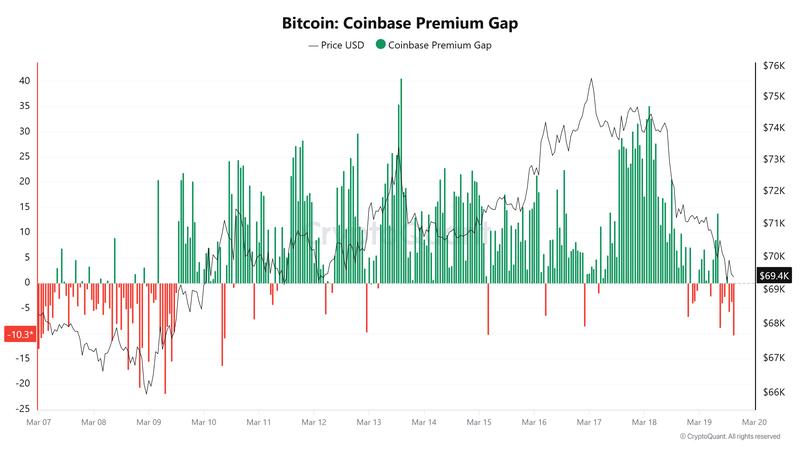
The recent price decline corresponds with a noticeable transition in market dynamics, with derivatives activity now driving price more than spot trading. Following a stretch of consistent demand, the Coinbase premium gap has turned negative, signaling lackluster participation from US-based market participants.
At the same time, IT Tech, a cryptocurrency analyst, identified a significant disparity between spot markets and perpetual futures contracts. The cumulative volume delta (CVD), a metric that measures net buying pressure versus selling across different markets, declined by $40.64 million in spot markets, while perpetual futures CVD plummeted by $506.75 million, demonstrating that leveraged traders are exhibiting more intense selling activity.
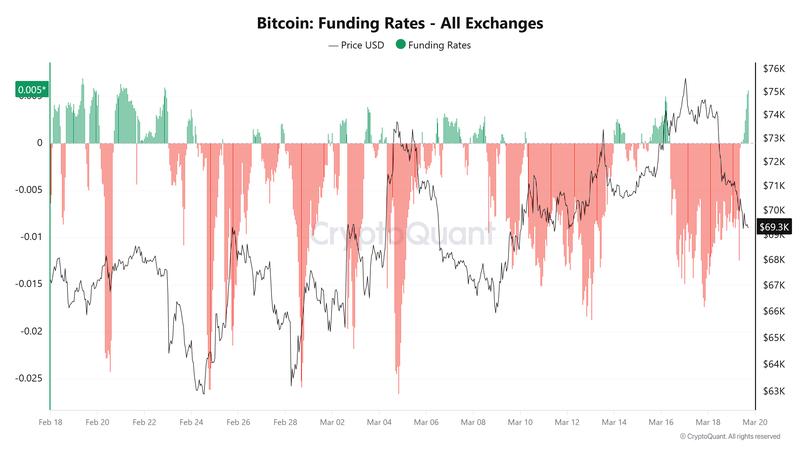
That said, funding rates have reversed to positive territory at 0.05%, which means traders holding long positions are compensating those holding short positions, demonstrating a bullish bias among derivatives market participants.
Analysis of order book data reveals that bid support is maintaining near the $70,000 area, with buying interest appearing dominant in both spot and perpetual futures markets.
Pattern formation resembles early-March recovery
Looking at shorter time intervals, Bitcoin is developing a fractal pattern similar to the correction witnessed between March 6 and March 8, during which the asset declined and swept through internal liquidity zones before staging an upward reversal on the charts.
The present price movement is following an identical sequence, characterized by consecutive lower lows that are evolving into what could become an exhaustion phase for the downward price action.
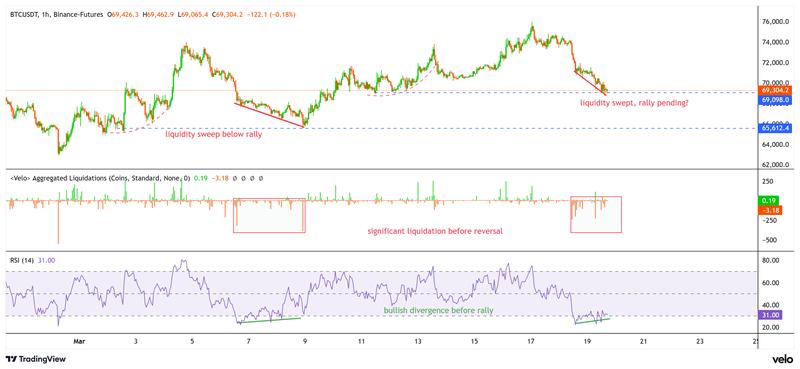
During the previous breakout, the reversal coincided with a bullish divergence appearing on the relative strength index (RSI) indicator, in which RSI maintained equal lows while the price established a lower low. This pattern indicated weakening momentum among sellers. A similar divergence is currently taking shape, strengthening the bullish fractal formation.
Liquidation metrics also validate this technical setup. Substantial liquidations of long positions have occurred during both instances, decreasing the overall open interest and eliminating overleveraged trading positions from the market.
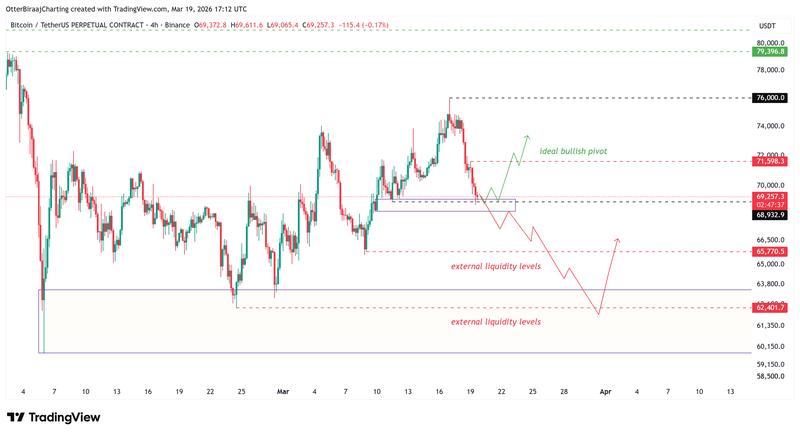
A rapid recovery above $70,000 would be consistent with the previous fractal recovery pattern, creating potential for a move toward $76,000. The $72,000 price level serves as the critical pivot point, where a successful reclaim could initiate a short squeeze if bearish positions become trapped.
Nevertheless, this setup is time-dependent. Should the price break down below $68,300, attention would shift toward the $65,000 and $62,000 levels, which represent higher time frame liquidity zones for BTC.
Ryan Scott, founder of Trading Stables, identified $73,000 as a crucial support base, observing that inability to hold above this threshold indicates insufficient buyer strength, increasing the likelihood of a decline to range lows around $62,000.