BTC Volatility Plunges 56% as Market Observers Predict Major 20% Price Swing
A dramatic decrease in Bitcoin's volatility aligns with a 114-day period of range-bound trading, creating conditions for a significant 10% to 20% price swing, though analysts cannot determine which direction.

The realized volatility of Bitcoin has declined to a mere 17.2%, representing one of the most suppressed readings witnessed in recent months. Several analysts tracking Bitcoin have noted that extended phases of price consolidation, combined with decreasing volatility metrics, have traditionally been followed by substantial double-digit price movements.
BTC realized volatility experiences 56% drop during Q2
Axel Adler Jr., a researcher focused on Bitcoin market dynamics, reported that the one-week realized volatility for BTC, when smoothed across a 30-day timeframe, has decreased to 17.2% from a previous 39% reading this quarter, representing a 56% reduction.
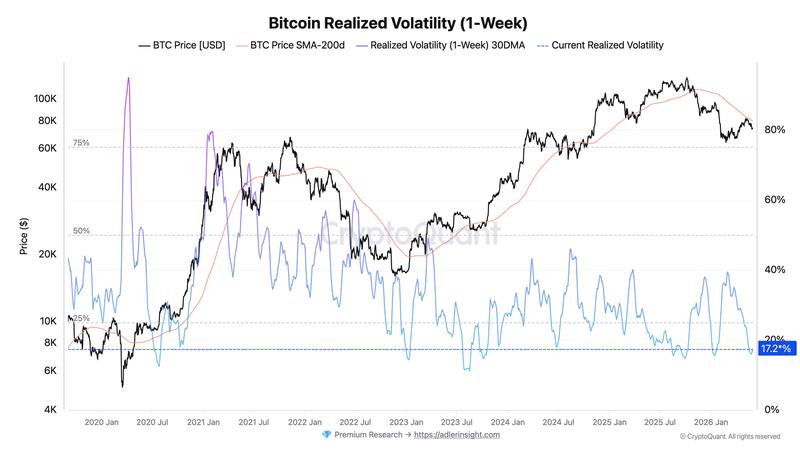
This realized volatility metric, which quantifies the actual magnitude of price fluctuations during a specified timeframe, remains significantly beneath its historical median of 40%. According to Adler's analysis, this type of volatility compression could potentially trigger a substantial price movement.
That said, the indicator doesn't provide directional guidance. Rather, it quantifies the accumulation of momentum during periods when price action becomes constrained.
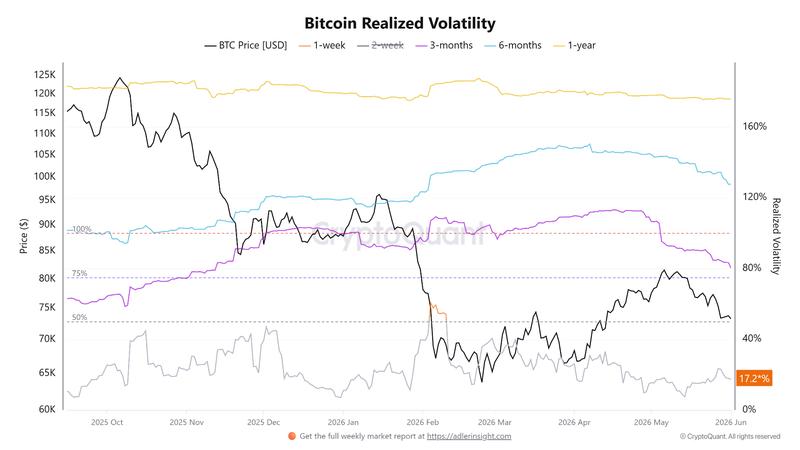
Volatility measurements across longer timeframes paint a consistent picture. The three-month realized volatility metric has dropped to 80% from 109% recorded in early April, while the six-month realized volatility measure decreased to 127% from 148%.
This decline observed across volatility measurements spanning multiple timeframes suggests that price action has entered a compressed state, a situation that has historically preceded more significant market movements.
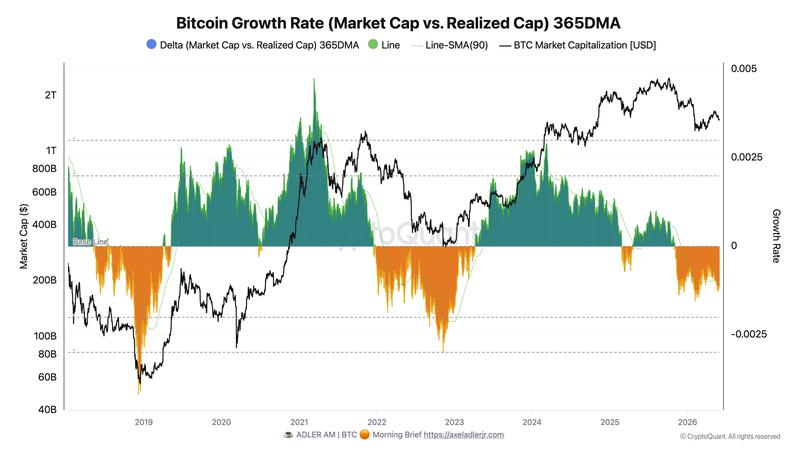
Network valuation metrics provide an additional dimension to the analysis. The Bitcoin growth rate indicator, which evaluates market capitalization expansion relative to realized capitalization, has maintained negative territory for over six months. The delta measurement, represented by a 365-day moving average, has recently declined to -0.0013, demonstrating that BTC's market valuation is expanding at a slower pace than its realized value.
According to Adler's assessment, these data points signal a market that is experiencing cooling conditions. The price of Bitcoin isn't climbing as rapidly as the capital being deployed into the network, which suggests market participants are adopting a more cautious stance amid diminished market volatility.
Bitcoin transitions into a "tug-of-war" period, according to market analyst
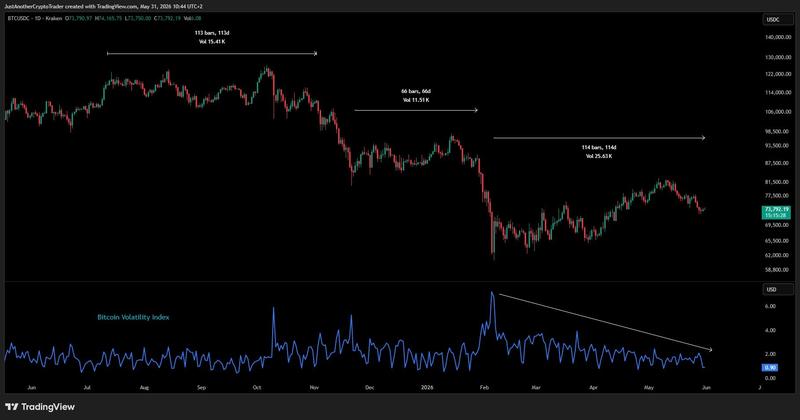
Maartunn, an analyst at CryptoQuant, observed that Bitcoin has remained confined within a wide trading range between $60,000 and $80,000 for 114 days, during which time the Bitcoin volatility index has descended toward multi-month lows approaching 0.90.
Based on Maartunn's historical analysis, comparable compression periods have typically been followed by price movements ranging from 10% to 20% after the established price range finally breaks.
Michael van de Poppe, founder of MN Capital, maintained an optimistic outlook on BTC, identifying the present price area as a critical support zone. Van de Poppe said,
"If history repeats itself, that means that we're going to see two great weeks of upwards momentum for Bitcoin and the end of this correction. It's a crucial support zone for Bitcoin, which needs to hold in order to prevent a test at $61,000 to happen."
In the meantime, Amr Taha, another CryptoQuant analyst, highlighted an emerging divergence in market dynamics. Bitcoin inflows to Binance over a 30-day period have increased by approximately $5.6 billion since April when examining both retail and whale participant groups. Inflows from retail participants grew by $3.6 billion, exceeding the $2 billion increase observed from whale wallet activity.
Simultaneously, wallet addresses containing between 1,000 and 10,000 BTC accumulated a total of 55,450 BTC on May 30, representing their most aggressive accumulation behavior since February. Taha added,
"For Bitcoin, this points to a tug-of-war phase. Exchange inflows are increasing, which may create near-term selling pressure, but large wallet accumulation is also returning, which could provide underlying support if demand remains strong."