BTC Surges to Multi-Month Peak as Short Sellers Face $7.9B Liquidation Wave: $90K in Sight?
Bitcoin's triple-wave short squeeze combined with climbing open interest around the $80,000 mark reveals an expanding market imbalance that may propel BTC toward fresh monthly peaks.

Bitcoin (BTC) appears positioned for a potential climb toward $90,000 following a massive $7.9 billion wave of short liquidations throughout February that applied significant pressure on bearish traders. According to data analysis, these liquidations occurred across three distinct waves spanning from February into April. These forced closures underscore an expanding imbalance in the market as BTC market participants persistently establish short positions beyond $80,000, even as the asset's price remains resilient, setting up recurring scenarios for additional short squeezes.
Successive short squeeze events intensify bearish pressure
Bitcoin analyst Axel Adler Jr. documented more than $7.9 billion worth of forced short position liquidations beginning in early February. The most significant surge reached $737 million on Feb. 13, with subsequent waves continuing throughout March and into April.
Daily liquidation volumes fluctuated between $2 million and $28 million before experiencing another sharp increase to $175 million on May 4. This particular surge materialized during an otherwise calm trading week, suggesting fresh short positioning emerged around the $80,000 price level. The recurring pattern demonstrates traders consistently reestablishing bearish bets at progressively higher price points.
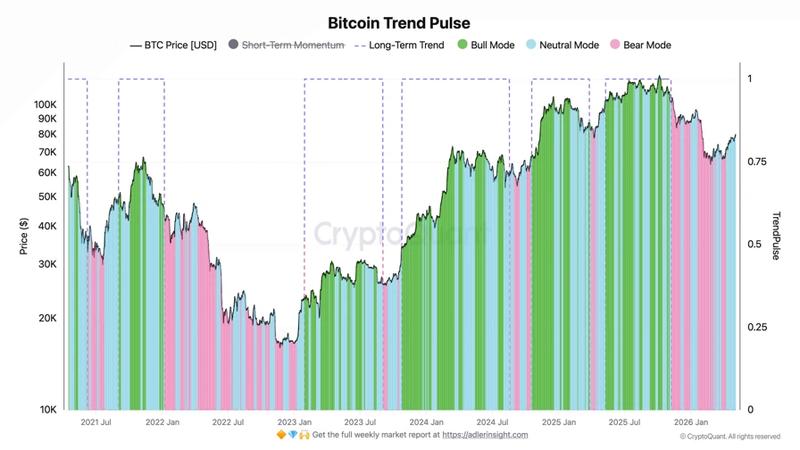
Data from the trend pulse model provides additional perspective on this market behavior. The indicator transitioned from bearish territory into neutral mode during early April. Short-term price momentum has shifted to positive territory, though the longer-term trend still requires confirmation through a bullish intersection of the 30-day and 200-day simple moving averages (SMAs).
According to Axel Adler Jr., every significant liquidation surge developed while the trend pulse indicator remained in neutral mode, representing a transitional period following bearish conditions but preceding complete bullish confirmation.
All major liquidation spikes materialized during this intermediary phase. The market price stood at a critical juncture, yet traders continued accumulating short positions.
This behavioral pattern reveals repeated instances of weakening strength followed by forced liquidations, generating upward pressure that could push prices even higher if current support levels maintain above the $80,000-$81,500 range.
BTC maintains crucial breakout territory beyond $80,000
Market strategist Coin Niel highlighted persistent BTC exchange outflows, with net transfers showing -837 BTC on May 5. This movement indicates continued accumulation activity, albeit at reduced levels compared to Monday's -6,590 BTC outflows, which maintains limited spot market selling pressure.
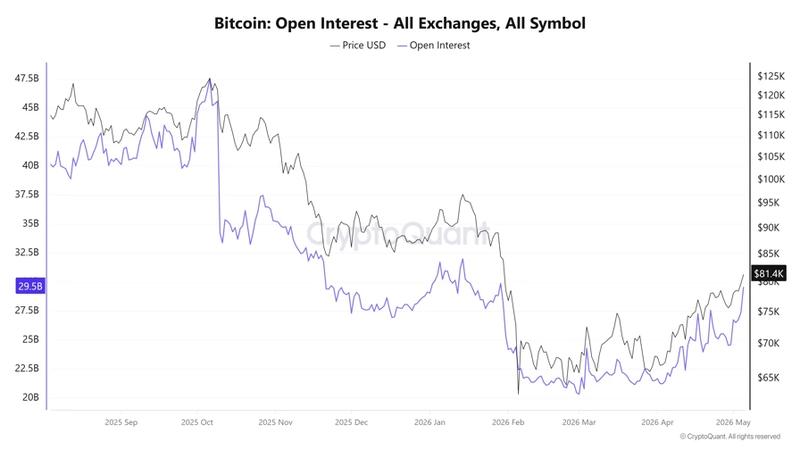
Funding rates stabilize around -0.0045, indicating that long positions aren't overcrowded while bearish pressure on the short side continues. BTC open interest increased 6% to reach $29 billion, marking the highest reading since Jan. 31, which amplifies the market's sensitivity to substantial price movements.
Bitcoin's price movement has adopted a constructive stance following BTC's break above a downward-sloping trendline that restricted upward movements throughout April. The 100-day exponential moving average (EMA) currently positions itself just beneath the current price, functioning as dynamic support.
BTC also maintains its position around $81,500, corresponding with the short-term holder cost basis, representing a critical threshold that preserves profitability for recent purchasers, potentially limiting additional selling activity.
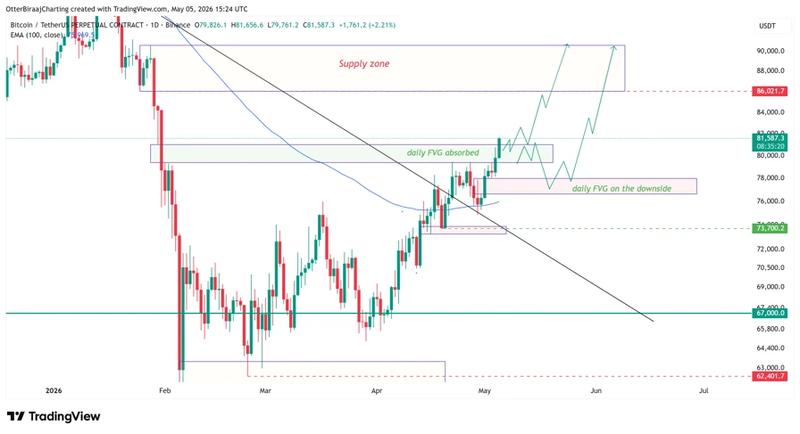
The potential upside target spanning $86,000 to $90,000 corresponds with a previous supply region, where market sellers previously emerged and stopped the price recovery. This zone represents a concentration of historical selling pressure, with comparatively fewer resistance obstacles preceding it.
On the downside, the $76,000–$78,000 range functions as the initial demand area, reinforced by recent market activity and an established daily fair-value gap formation from the previous Friday.
Cryptocurrency analyst KriptoHolder observed that liquidation concentration zones are influencing immediate price direction. Short liquidation clusters concentrate around $81,000–$82,000, whereas a more substantial pool of long position exposure exists between $77,000 and $78,000.
Market data reveals $1.12 billion in accumulated short positions face liquidation risk near $82,500, contrasted with more than $4.2 billion in long positions vulnerable to liquidation around $77,000, establishing a narrow liquidity imbalance.