BTC Surges to $73K Following Mild US Inflation Report Despite Historic Gasoline Price Jump
The leading cryptocurrency made another push toward recent peak levels after US CPI figures registered below forecasts, even as gasoline costs posted record gains.
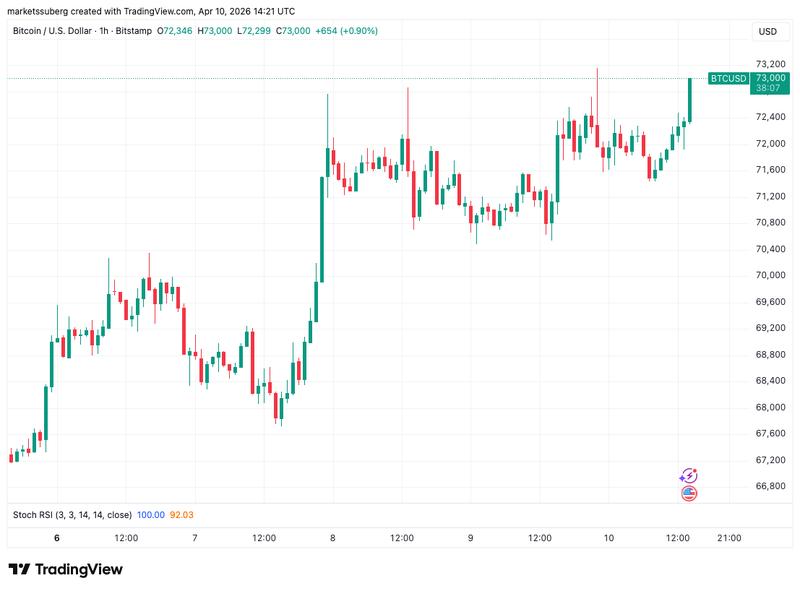
Following the opening bell on Wall Street this Friday, Bitcoin (BTC) reached the $73,000 level as critical inflation statistics from the United States registered lower than market forecasts anticipated.
Key points:
- Bitcoin climbs moderately as Consumer Price Index figures from the US arrive marginally under analyst predictions.
- The CPI report reveals an unprecedented monthly jump in gasoline costs.
- Market participants in Bitcoin trading identify crucial overhead resistance points.
Bitcoin price targets fresh local peaks following inflation data
According to information sourced from TradingView, the BTC price action showed movement toward fresh multi-week peak levels as financial markets processed the Consumer Price Index (CPI) figures for March.
The macroeconomic data point represented the week's most significant release, marking the initial CPI report capturing the effects stemming from the conflict between the US and Israel in Iran.
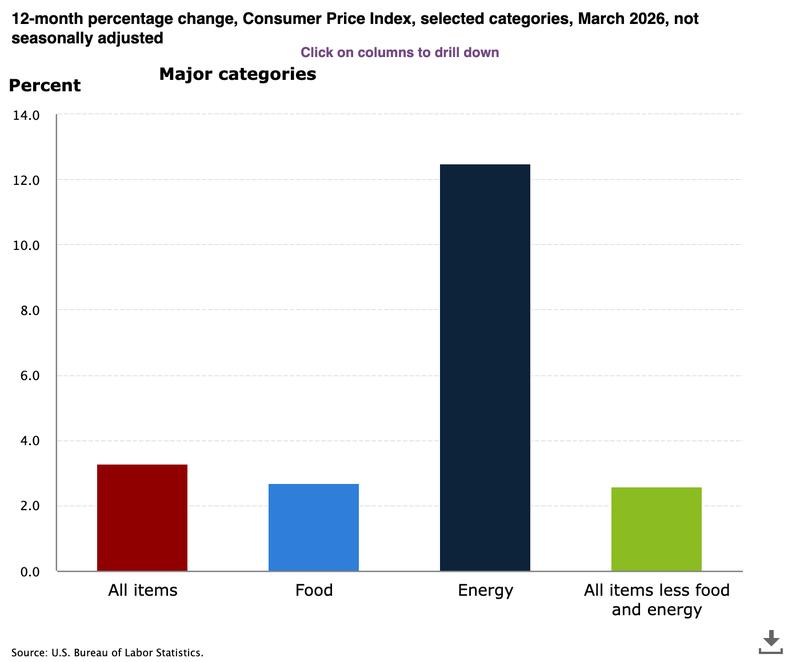
According to confirmation from the Bureau of Labor Statistics (BLS), gasoline costs surged more than 21% on a month-over-month basis, though the aggregate CPI figure landed 0.1% beneath market projections.
"Over the last 12 months, the all items index increased 3.3 percent before seasonal adjustment," an official news release read.
"The index for energy rose 10.9 percent in March, led by a 21.2-percent increase in the index for gasoline which accounted for nearly three quarters of the monthly all items increase."
In response to the data, trading analysis platform The Kobeissi Letter observed that the monthly gasoline price surge in the CPI represented the most substantial single-month gain recorded since 1967. In an additional post shared on X, the resource highlighted that the energy sector increase marked the highest level witnessed since 2005.
Given the resulting complex picture of inflation dynamics, equity markets in the United States showed predominantly sideways movement at the opening session, while price action in BTC similarly refrained from significant directional movements either upward or downward.
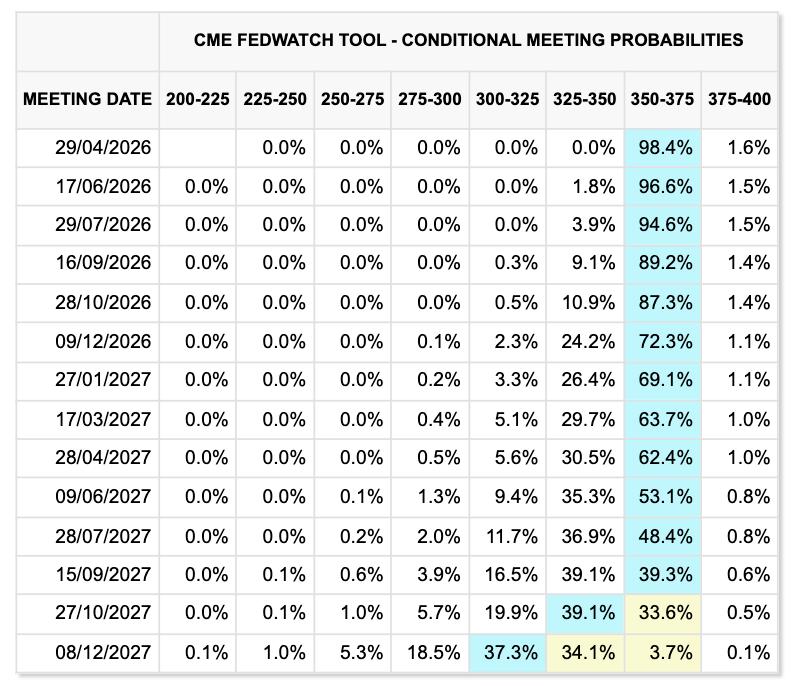
Financial markets, nonetheless, held zero expectations regarding potential Federal Reserve interest rate reductions — a position that had already been established following Thursday's release of the Personal Consumption Expenditures (PCE) index, according to information from CME Group's FedWatch Tool.
Market participants in Bitcoin identify upcoming resistance areas
Within the Bitcoin trading community, there existed measured reasons for maintaining a positive outlook regarding near-term price trajectories.
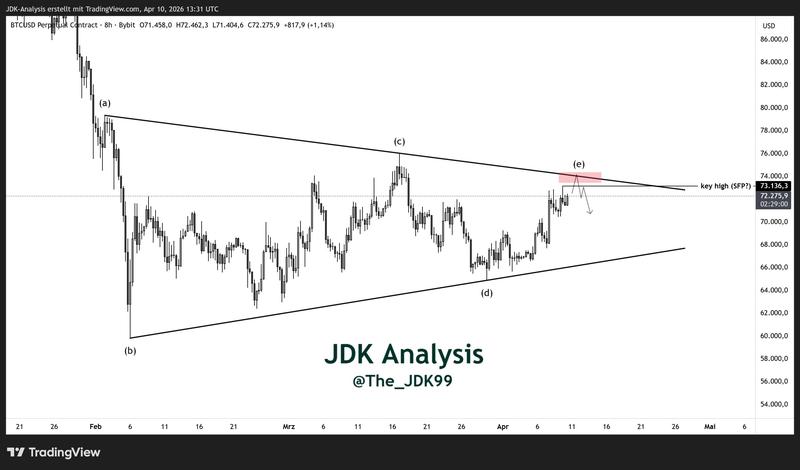
In their most recent analysis published on X, trading analyst JDK Analysis highlighted BTC/USD price movement occurring within a contracting wedge formation — a subject that has generated discussion among traders since February.
"If price makes another attempt at the current key high, the reaction there will be critical!" they wrote in accompanying commentary.
Meanwhile, market analyst Daan Crypto Trades focused attention on exchange order-book liquidity positioned beneath the $74,000 threshold.
In previous coverage, Cointelegraph provided reporting on a parallel signal emerging from Bitcoin's relative strength index (RSI) that displayed similarities to patterns observed during the conclusion of the 2022 bear market cycle.