BTC Surges 11% Back to $65K After Dip: Identifying the Buyers
Institutional investors capitalized on Bitcoin falling below $60,000 as a buying opportunity while the broader cryptocurrency market experienced $2.6 billion in liquidations.

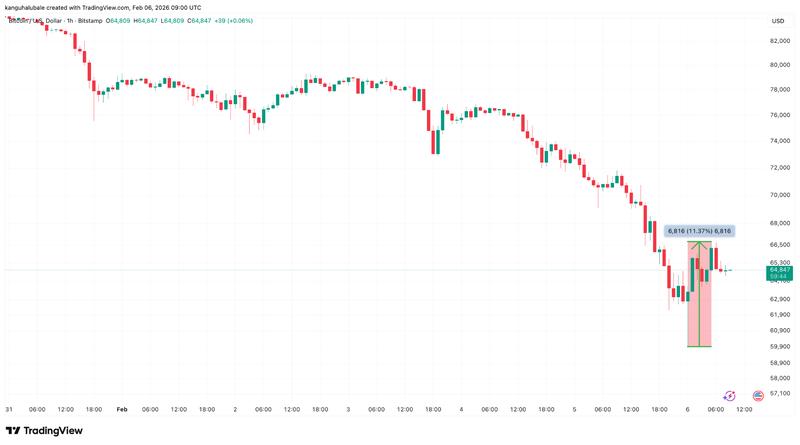
On Friday, Bitcoin (BTC) climbed back above the $65,000 threshold, marking an 11% recovery from its 15-month low beneath $60,000, with market attention turning toward institutional investors who purchased during the decline.
Key takeaways:
- On Thursday, Bitcoin plunged to $59,000, triggering liquidations exceeding $1.1 billion in long BTC positions.
- Market participants willing to purchase during price declines finally emerged when Bitcoin fell below the $60,000 threshold.
- Market analysts have identified $58,000 as Bitcoin's critical support level that must hold.
Thursday's plunge to $59,000 liquidates $1.1 billion in Bitcoin longs
On Thursday, the price of Bitcoin descended to as low as $60,000, wiping out gains accumulated over the previous 15 months while market participants increased their holdings at these reduced price levels.
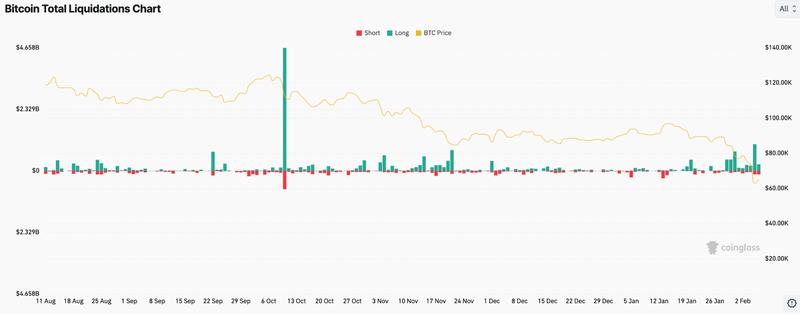
The decline extended Bitcoin's retreat from its peak of $126,000 achieved on Oct. 6, 2025, to a 50% drawdown and triggered substantial liquidations throughout the derivatives trading sector.
According to data compiled by monitoring platform CoinGlass, cryptocurrency liquidations reached approximately $2.6 billion within a 24-hour period, with long positions representing $2.15 billion of that total. Long Bitcoin positions alone accounted for $1.1 billion in liquidations.
Institutional buyers step in during Bitcoin price decline
The Secure Asset Fund for Users (SAFU) operated by Binance, which serves as an insurance mechanism launched by Binance in July 2018 for the protection of user holdings, acquired an additional 3,600 BTC valued at $250 million at a price point of roughly $65,000 per BTC.
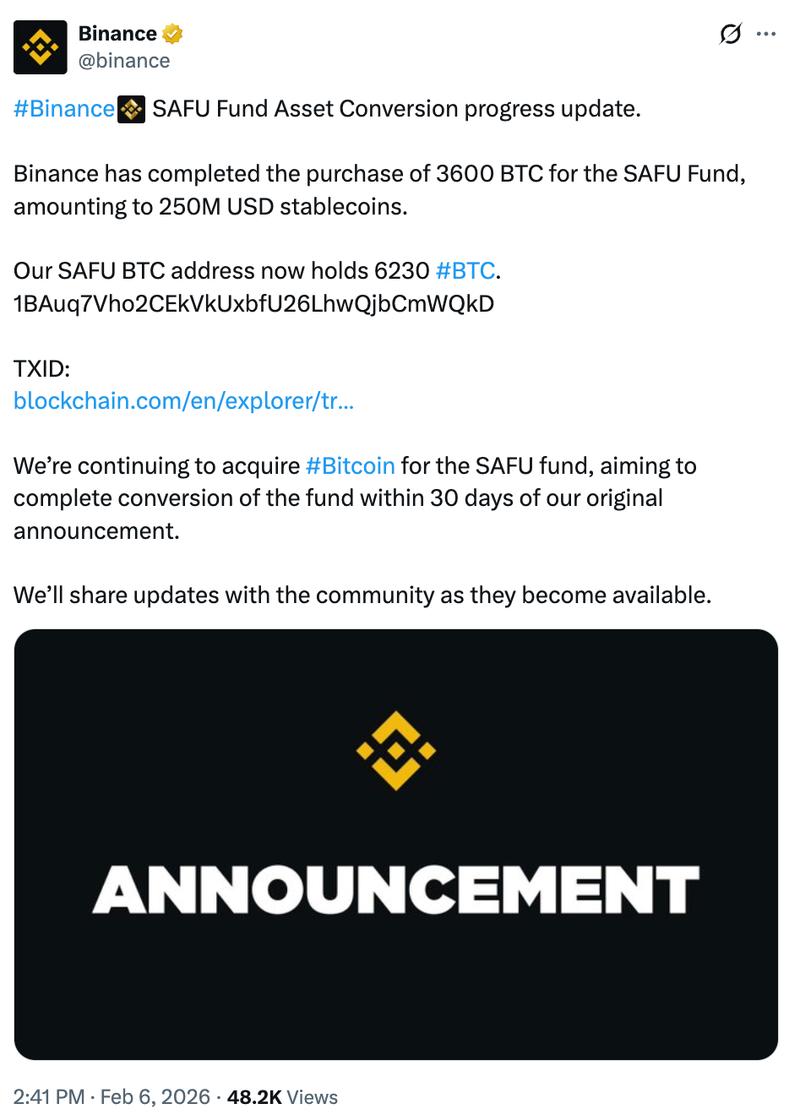
During the previous week, Binance revealed plans to convert $1 billion from SAFU reserves into Bitcoin throughout the upcoming 30 days.
Earlier this week, the exchange completed its initial purchase of 1,315 BTC, representing approximately $100 million in value, which leaves an additional $565 million remaining for conversion.
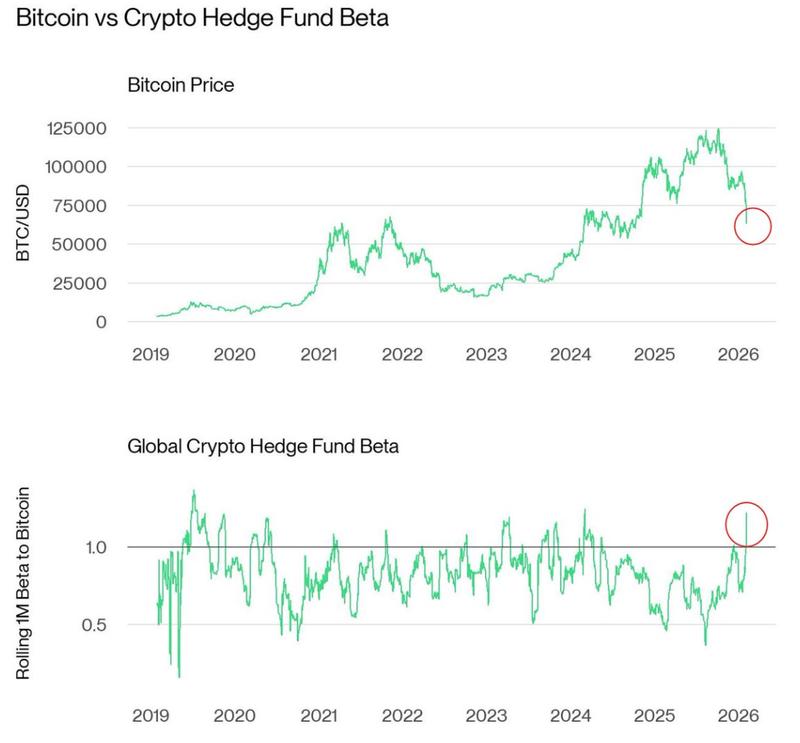
According to information from Bitwise, cryptocurrency hedge funds have similarly engaged in purchasing during the market decline.
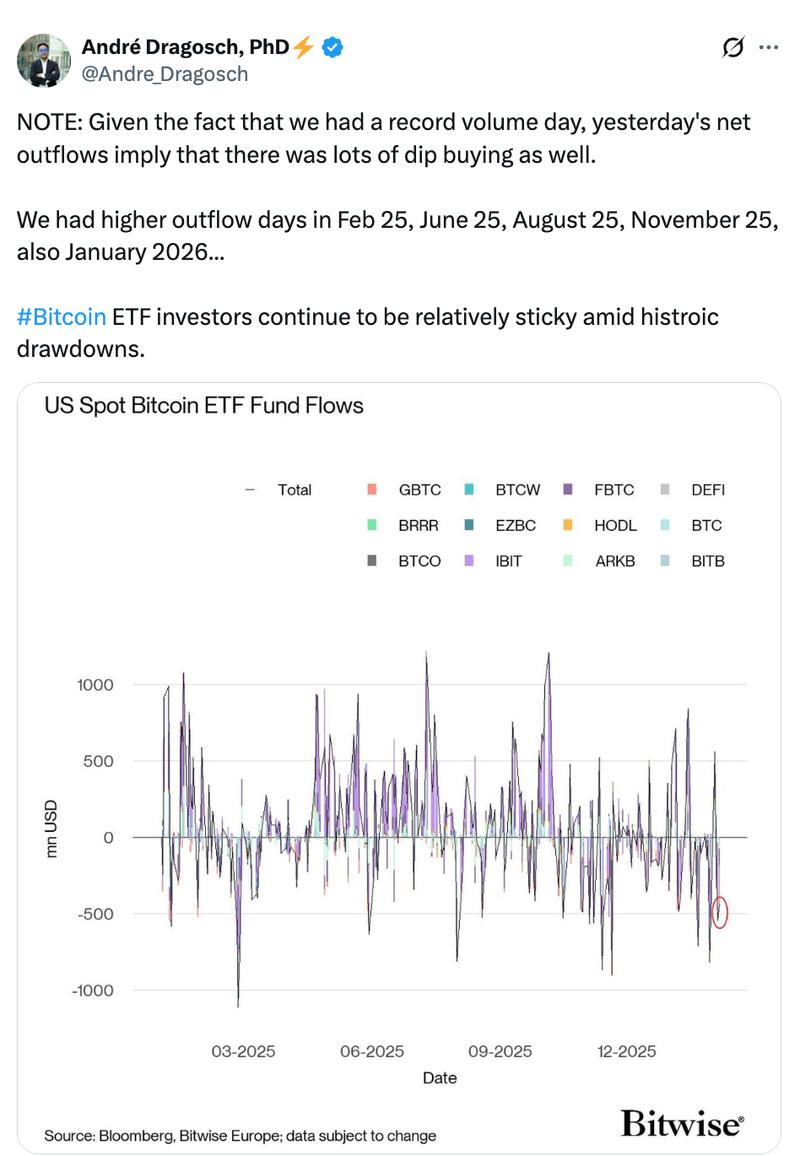
André Dragosch, European Head of Research at Bitwise, noted in a Friday social media post on X that the combined market beta across worldwide crypto hedge funds reached its "highest level in 2 years" during Bitcoin's weakness, further commenting:
"This signals increasing $BTC market exposure by global crypto hedge funds."
Dragosch further indicated that Thursday's record-breaking ETF trading volumes combined with modest net outflows pointed to substantial "dip buying" activity from American spot Bitcoin ETF investors as well.
Will the 200-week MA serve as Bitcoin's critical support?
Following BTC's sweep of lows beneath $60,000, market traders are now questioning at what price level Bitcoin might establish a floor.
In a Friday post on X, trader Jelle observed, "$BTC is testing the previous cycle highs, and bouncing slightly so far."
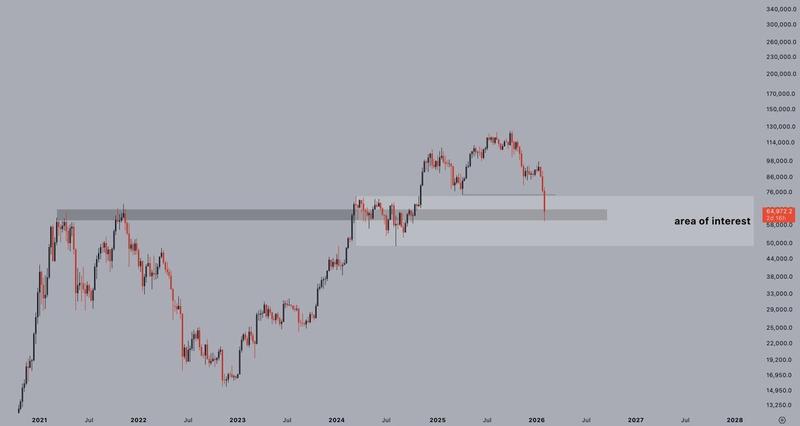
Jelle's analysis suggests that Bitcoin must successfully maintain a critical zone ranging from $58,000 to $62,000 in order to prevent an even more severe market correction.
"Time to see if we start basing here, or if we just roll over again."
According to Michael van de Poppe, founder of MN Capital, the $58,000 price point aligns with the 200-day SMA, representing a crucial support threshold for BTC price action.
Van de Poppe suggested that because Thursday's $10,000 decline produced the highest volume candle ever recorded, the "assumption can be made that we hit the low there, for now," while also stating:
"If prices can rally up slightly, we're going to see a large wick. Like we always see with capitulation events."
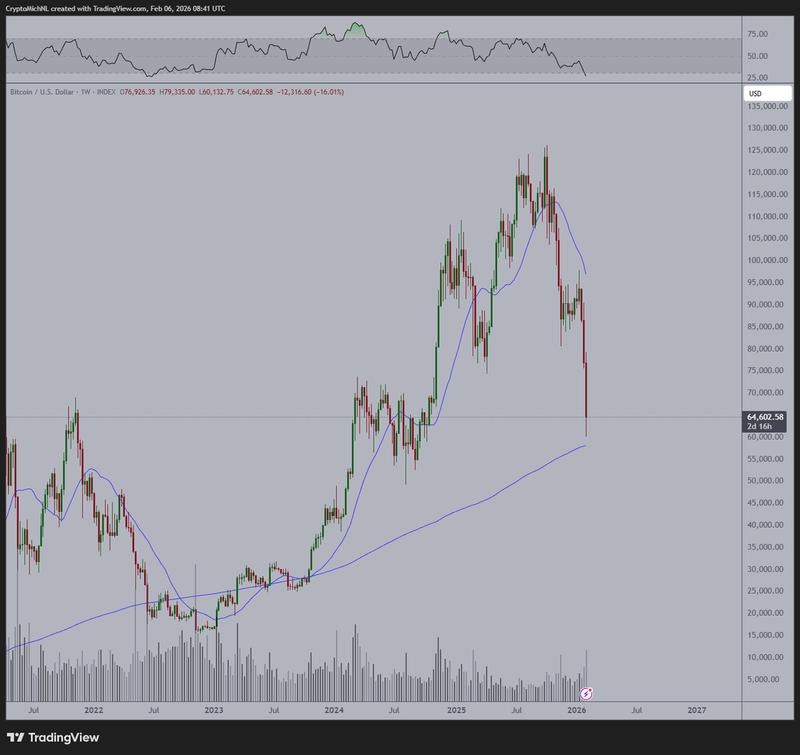
According to previous reporting by Cointelegraph, Bitcoin's current demand zone is now positioned above $58,000, reinforced by substantial historical transaction volumes and the 200-week moving average.