BTC spot trading activity plummets to September 2023 levels amid headline-driven price movements
BTC surged past $71,600 during early US trading hours, though the upward movement was not supported by robust spot trading volumes. Will bullish momentum keep Bitcoin above the $70,000 threshold?

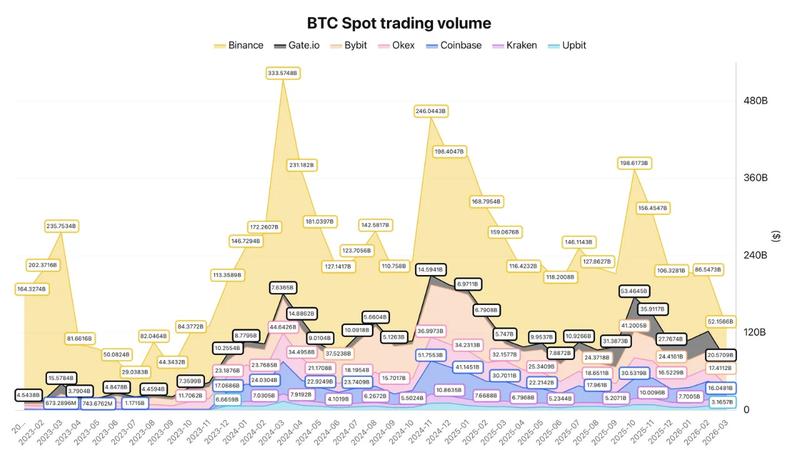
Spot trading volumes for Bitcoin (BTC) on the Binance exchange have fallen to levels not witnessed since September 2023, suggesting that today's intraday price surge may lack substantial underlying demand.
Monday's climb beyond $71,700 seems to be primarily fueled by news-related catalysts and liquidation events occurring within Bitcoin futures trading platforms.
Exchange volumes and flow metrics reveal BTC demand deficiency
According to crypto analyst Darkfost, March is currently trending toward recording Binance's weakest spot volume performance since the third quarter of 2023, reaching approximately $52 billion, a significant decrease from the $88 billion figure observed in September 2023. These activity metrics mirror conditions seen during previous bear market cycles, suggesting diminished market participation.
Exchange flow metrics demonstrate a comparable deceleration. Cryptocurrency analyst Arab Chain documented $6.38 billion in cumulative seven-day flows on Binance alongside $5.14 billion on Coinbase. Binance's flow figures have declined to their weakest point since 2024, signaling decreased deposit engagement.
Nevertheless, reduced inflows could also correspond with diminished selling pressure, given that fewer coins are being transferred to exchanges. Coinbase flow data remains comparatively steady, demonstrating more consistent engagement from long-term holding investors.
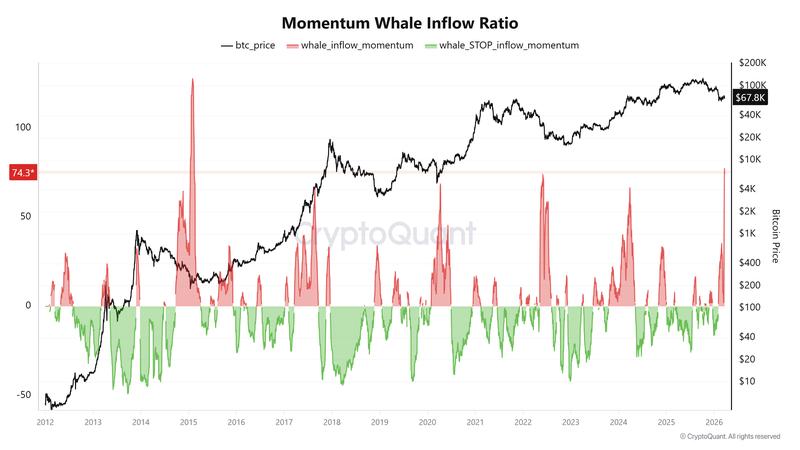
Large-holder behavior introduced an additional dimension to consider. Market analyst Gaah detected an unprecedented spike in whale inflow momentum, a metric that monitors the velocity of change in substantial transfers directed toward exchanges.
The present measurement of 74.3 exceeds all previous cycle highs throughout the preceding 11 years, with the only higher reading recorded at 124.6 in 2015.
This heightened inflow velocity indicates aggressive capital reallocation and hedging strategies, amplifying BTC's susceptibility to near-term price fluctuations during the upcoming weeks.
Bitcoin liquidation patterns reveal trader uncertainty
The BTC price rally emerged after news reports indicated that President Trump had postponed the scheduled US strikes targeting Iran's energy infrastructure for five days following cited progress in diplomatic discussions, though Iran's foreign ministry subsequently rejected this assertion, denying that any negotiations had occurred.
BTC nevertheless climbed to a weekly peak of $71,789 on Binance throughout the US trading session, propelled by the aforementioned external factor instead of spot demand or futures market positioning leading the advance.
Available data reveals the rally corresponded with declining leverage usage. Aggregated open interest decreased by approximately 9,700 BTC, representing a 4% reduction across 13 hours.
Open interest measures the total count of outstanding futures contracts, and its decline during rising prices indicates that existing positions were being liquidated rather than fresh positions being established.
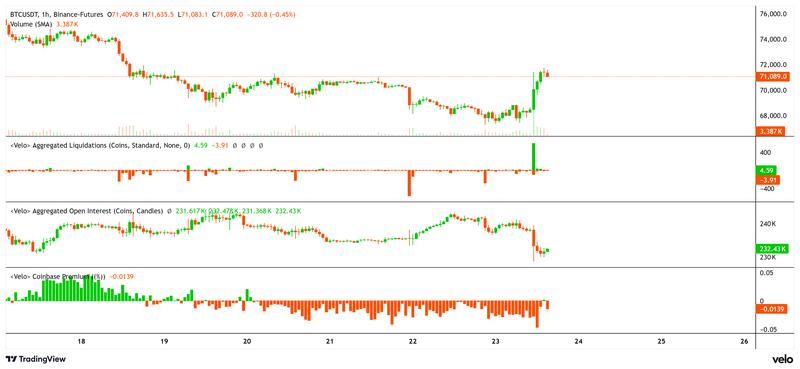
This pattern of movement commonly emerges when short positions experience forced liquidations, decreasing overall market exposure while simultaneously driving prices upward. Binance documented more than $44 million in short position liquidations within a single hour, representing the largest such event since the one-hour long liquidations totaling $53 million on Feb. 6.
The Coinbase premium (measured in percentage terms) stayed negative throughout this price movement, demonstrating insufficient spot buying interest from United States market participants.
The declining open interest figures, elevated liquidation activity, and subdued premium indicators suggest the upward price action resulted from position closures rather than fresh capital entering the marketplace, with the majority of trading activity concentrated within the $71,000–$72,000 price range.