BTC Set for Extended Consolidation Period, Analysts Warn
According to Glassnode's latest analysis, Bitcoin finds itself trapped within critical cost-basis boundaries, suggesting an extended period of sideways price movement could be imminent for BTC despite active dip-buying activity at range support levels.

Recent analysis from on-chain analytics firm Glassnode suggests that Bitcoin (BTC) may be entering an extended period of sideways price movement, characterized by "range-bound" trading unless critical resistance thresholds are successfully breached.
Key takeaways:
- Bitcoin remains confined within critical cost-basis boundaries, with patterns suggesting a potential 2022-style consolidation scenario unless major support zones are successfully recovered.
- Breaking above the $72,000 resistance barrier is essential for Bitcoin price to escape the current consolidation pattern.
Bitcoin confronts significant overhead resistance
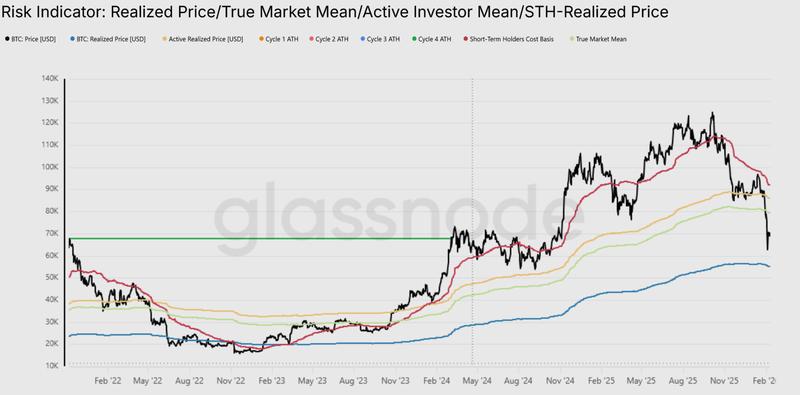
The BTC/USD trading pair currently operates within a newly established corridor, bounded by the True Market Mean positioned at approximately $79,200 and the realized price hovering around $55,000. This configuration bears striking similarities to the market structure witnessed throughout the initial six months of 2022.
Glassnode's assessment indicates that Bitcoin's valuation will likely continue fluctuating within this established corridor until fresh market participants enter and progressively absorb available supply.
The analytical chart demonstrates that during the timeframe spanning from April 2022 through June 2022, price action remained confined between the True Market Mean and the Realized Price metrics before transitioning into a prolonged bearish cycle, ultimately reaching a low point near $15,000 in November 2022.
Escaping from this current range would necessitate a significant catalyst event, "either a decisive reclaim of the True Market Mean near $79.2K, signaling renewed structural strength, or a systemic dislocation similar to LUNA or FTX that forces price below the Realized Price around $55K," Glassnode said, adding:
"In the absence of such extremes, a prolonged phase of range-bound absorption remains the most probable path for the mid-term market."
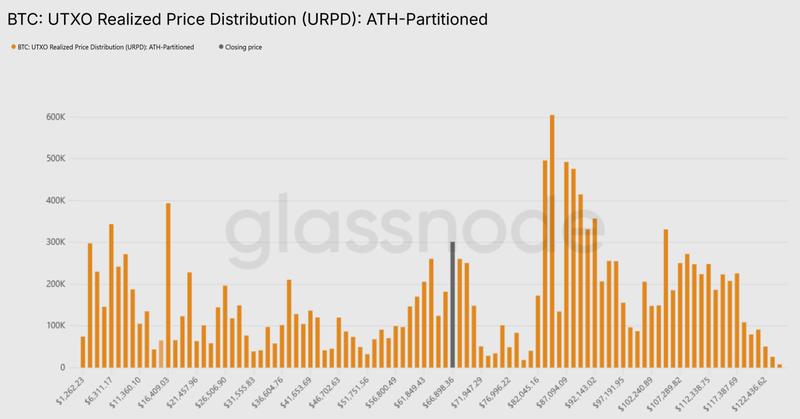
The UTXO Realized Price Distribution (URPD) metric from Glassnode, which illustrates the price levels at which existing Bitcoin UTXOs were originally established, has also identified extensive and concentrated supply clusters positioned above the $82,000 threshold, progressively transitioning into long-term holder categories.
"Overhead supply remains structurally heavy, with significant clusters positioned between $82K–$97K and $100K–$117K, representing cohorts now holding substantial unrealized losses," the onchain data analytics platform said, adding:
"These zones may act as latent sell-side overhang, particularly if prolonged time under water or renewed downside volatility triggers further capitulation."
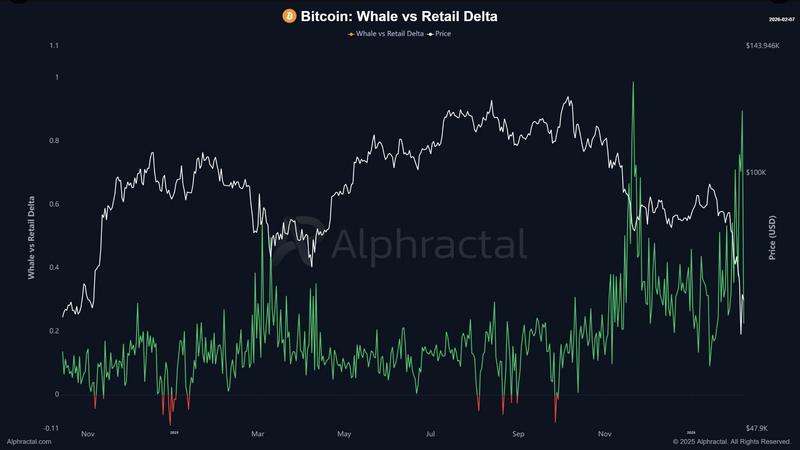
Large Bitcoin holders "whales are closing longs and opening shorts relative to retail," said founder and CEO of Alphractal Joao Wedson in a recent X post, adding:
"There is a high probability that Bitcoin will enter a consolidation phase, ranging and building structure over the next 30 days."
Bitcoin valuation remains constrained between critical thresholds
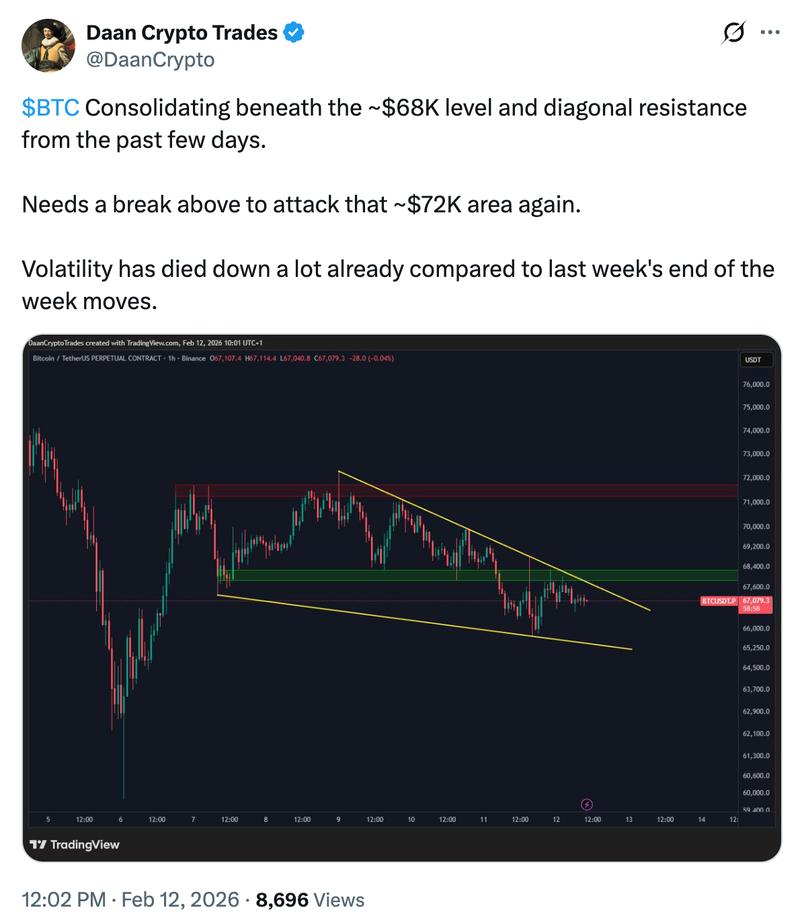
Following Bitcoin's 20% rebound from 15-month lows positioned beneath $60,000, the recovery attempt encountered strong resistance at the $72,000 price level.
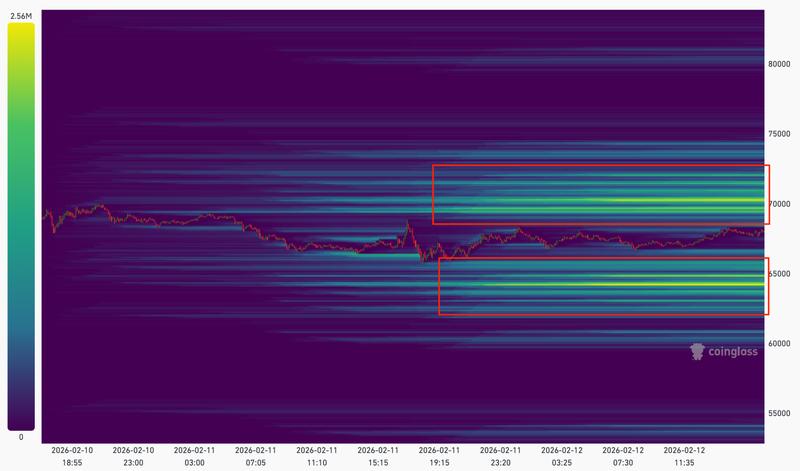
Currently, price action is consolidating between the newly formed support zone beneath $65,000 and resistance positioned at $68,000, which market analyst Daan Crypto Trades indicated bulls must "break above to attack $72,000 again."
The liquidation heatmap provided by CoinGlass illustrates Bitcoin trapped in a characteristic liquidation sandwich formation, with substantial ask orders concentrated between $69,000 and $72,000, while dense bid positions accumulate below $66,000, as demonstrated in the visualization below. This pattern emphasizes the constrained nature of the present market structure.
As previously documented by Cointelegraph, Bitcoin must successfully breach resistance positioned at $72,000 to revive the hopes of a recovery toward the 20-day EMA at $76,000 and the 50-day SMA above $85,000, suggesting that the BTC price may have bottomed out in the near term.