BTC Reaches Deepest 'Undervaluation' Level in Three Years at $20K, Key Metric Reveals
On-chain data analysis indicates Bitcoin's potential downtrend reversal as the MVRV metric drops to territory unseen since early 2023.

For the first time in three years, Bitcoin (BTC) is entering "undervalued" price territory as a traditional indicator approaches a critical inflection threshold.
Key points:
- Research indicates Bitcoin hasn't been this "undervalued" relative to its market capitalization since March 2023.
- For the first time in more than three years, the MVRV ratio is nearing its crucial breakeven threshold.
- Analysis of MVRV data suggests Bitcoin is currently in the process of downtrend reversal.
BTC valuation indicator mirrors $20,000 price level
On Friday, onchain analytics platform CryptoQuant published research highlighting significant movements in Bitcoin's market value to realized value (MVRV) ratio metric.
The MVRV ratio, a traditional BTC price measurement tool, evaluates Bitcoin's market capitalization against the price point at which the circulating supply last transferred, referred to as its "realized cap."
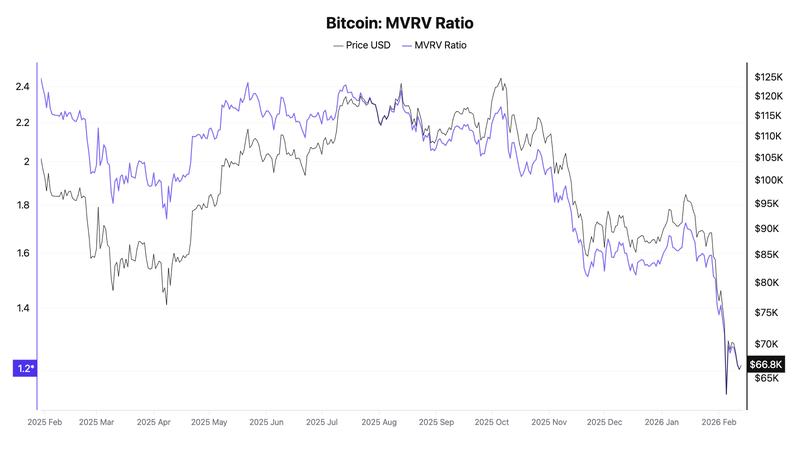
When values drop below 1, it indicates that the circulating supply is undervalued based on current market prices. During last week's decline when BTC/USD fell beneath $60,000, the MVRV reached 1.13 — marking its lowest point since March 2023, when Bitcoin was valued at merely $20,000.
"After reaching its all-time high in October 2025, Bitcoin has experienced a downward trajectory for roughly four months and is currently nearing territory that can be classified as undervalued," noted Crypto Dan, a CryptoQuant contributor.
"Typically, Bitcoin is considered undervalued when the MVRV ratio drops below 1. Currently, the indicator is positioned at approximately 1.1, indicating that price levels are approaching the undervaluation territory."
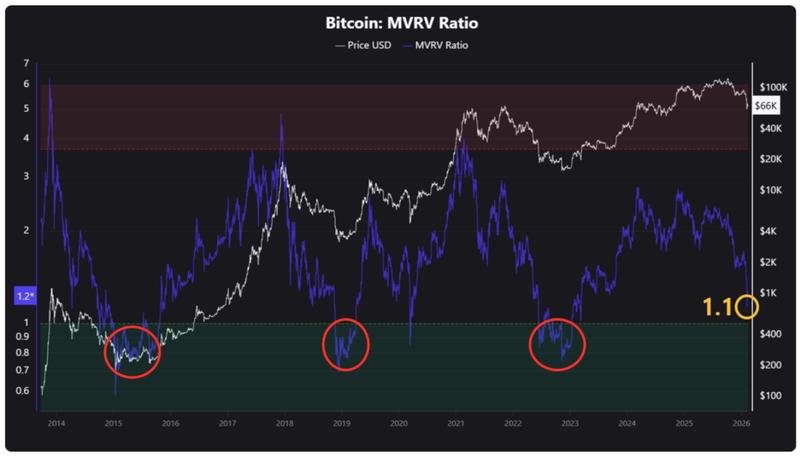
The MVRV indicator last recorded a reading below 1 at the beginning of 2023. During Bitcoin's most recent all-time high achieved last October, the ratio climbed to a peak of 2.28.
Crypto Dan raised doubts about whether Bitcoin's 52% decline from all-time highs was justified. He contended that neither the peak nor the trough exhibited characteristics typical of standard MVRV behavior patterns.
"Nevertheless, in contrast to previous cycles, Bitcoin failed to experience a rapid surge into an obviously overvalued territory during the most recent bull cycle," the research post explained.
"This difference is crucial to acknowledge. Consequently, the current downturn may also deviate from historical market bottoms, and it seems essential to approach this with such a scenario in consideration."
BTC price floor "being forged right now"
During January, Cointelegraph published a report on preliminary indicators suggesting that BTC price action could be setting up for a trend reversal.
When examined on two-year rolling timeframes, the Z-score of the MVRV ratio, which calculates its readings divided by the standard deviation of market capitalization, recently dropped to historically unprecedented lows.
"The current Z-Score of $BTC is lower than during the bear market bottom in 2015, 2018, COVID crash 2020 and 2022," remarked Michaël van de Poppe, crypto trader, analyst and entrepreneur, at that time.
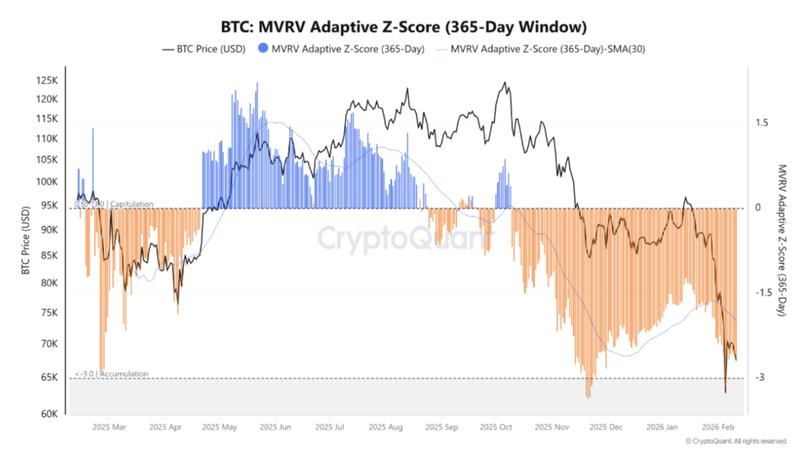
During this week, CryptoQuant contributor GugaOnChain employed an alternative Z-score variation to demonstrate that BTC/USD had entered a "capitulation zone."
"The indicator reveals that we are nearing the historical accumulation phase," he stated in a related post.
"The statistical deviation of the Z-Score screams opportunity, signaling that the bottom of this downtrend is being forged right now."