BTC Reaches $63.2K Despite US Inflation Surge and Iran's Strait of Hormuz Blockade
Despite escalating US inflation pressures and Iran's announcement of a full Strait of Hormuz oil route blockade, Bitcoin successfully climbs back to the $63,000 level.

On Thursday, Bitcoin (BTC) successfully climbed back to the $63,000 mark as the cryptocurrency market dismissed reports of Iran shutting down a critical global oil transportation corridor.
Key points:
- Despite rising US inflation and yet another Strait of Hormuz shutdown, Bitcoin experiences volatility while reaching intraday peaks.
- Following US promises of additional strikes on Iranian infrastructure scheduled for Thursday, oil prices rebound.
- The focus of Bitcoin's potential upward movement centers on the unfilled gaps present in CME Group's futures trading platform.
Fresh headwinds for risk assets emerge from Iran tensions and PPI inflation
According to TradingView data, BTC/USD reached local peaks of $63,200 on the Bitstamp exchange, representing a daily increase exceeding 2.5%.
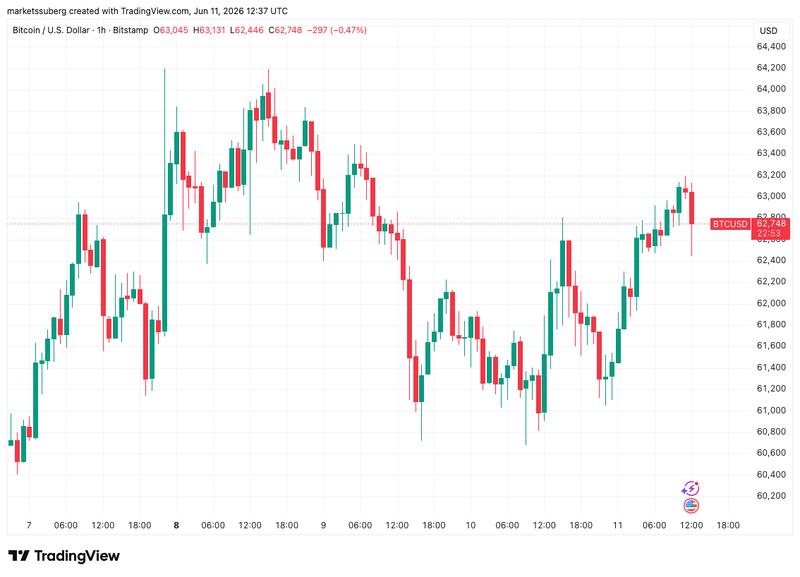
The cryptocurrency market experienced a recovery despite escalating geopolitical tensions and the potential impact these conflicts could have on global inflation patterns. News outlets reported Iran's closure of the Strait of Hormuz "until further notice" in response to strikes targeting US infrastructure located in Gulf state regions.
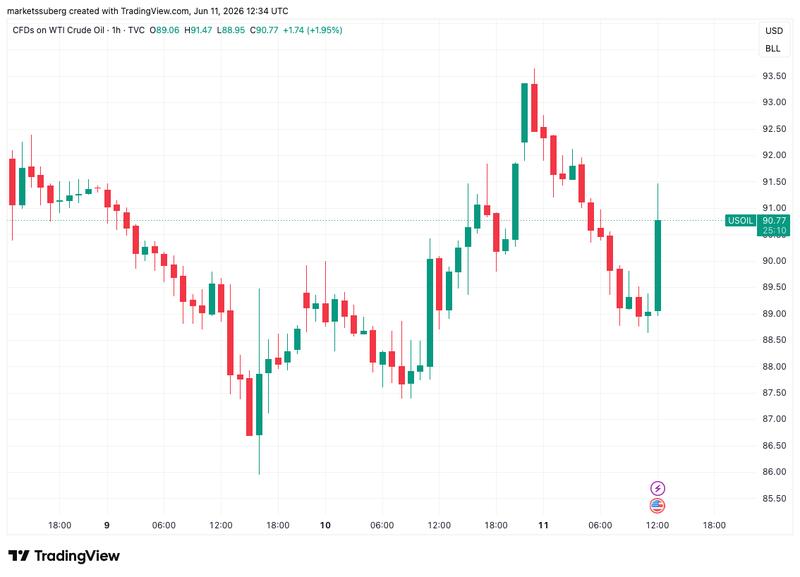
In the wake of this announcement, US WTI crude oil prices surged past the $91 per barrel threshold.
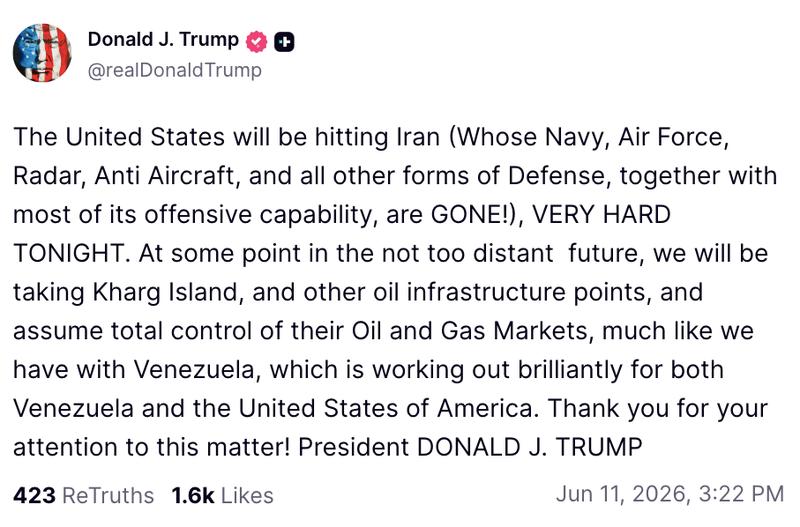
President Donald Trump of the United States issued an additional warning stating that Iran would face consequences "very hard" scheduled for Thursday evening.
"At some point in the not too distant future, we will be taking Kharg Island, and other oil infrastructure points, and assume total control of their Oil and Gas Markets, much like we have with Venezuela, which is working out brilliantly for both Venezuela and the United States of America," he wrote in a post on Truth Social.
One day earlier, Trump declared that Washington maintains "control" over Hormuz, through which approximately 100 million barrels of oil pass daily.
QCP Capital, a trading firm, provided analysis in its most recent report explaining that financial markets were "being forced to price both military escalation risk and potential energy disruption risk at the same time."
"That combination leaves risk assets in an awkward position," it wrote in a Market Color bulletin on Wednesday.
"Investors may not be panicking, but they are clearly less willing to lean into exposure when the next headline could pull the market in either direction."
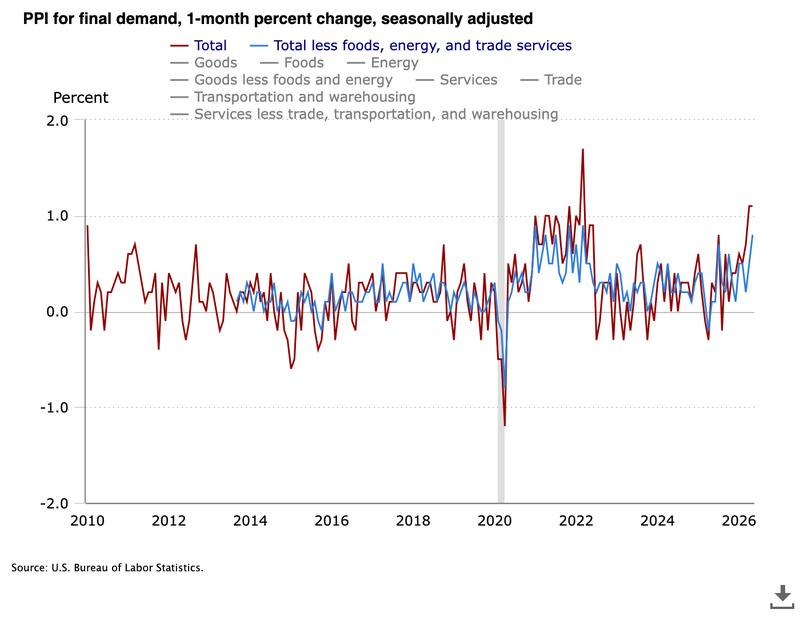
Meanwhile, Thursday's release of the US Producer Price Index (PPI) data maintained downward pressure on cryptocurrency markets and risk-oriented assets.
According to the Bureau of Labor Statistics (BLS), the year-on-year PPI increase represented the highest surge in almost four years, maintaining a pattern established over recent months.
"For the 12 months ended in May, prices for final demand less foods, energy, and trade services moved up 5.1 percent, the largest 12-month rise since jumping 5.5 percent in October 2022," an official press release stated.
The previous day on Wednesday, the May reading for the US Consumer Price Index (CPI) registered at 4.2% on a year-on-year basis, marking the highest rate of growth since April 2023.
According to a press release issued by the BLS, energy costs were the primary factor driving the increase.
"The energy index increased 23.5 percent for the 12 months ending May," it reported.
BTC price upside targets remain focused on CME gaps
Within Bitcoin trading communities, focus remained concentrated on maintaining support at the $60,000 level, while bulls continued searching for momentum to push higher.
"It's quite simple for Bitcoin," crypto trader and analyst Michaël van de Poppe told X followers on the day.
"Break through the areas at $63.3K and $65.8K and we'll be looking at a lot more upside."
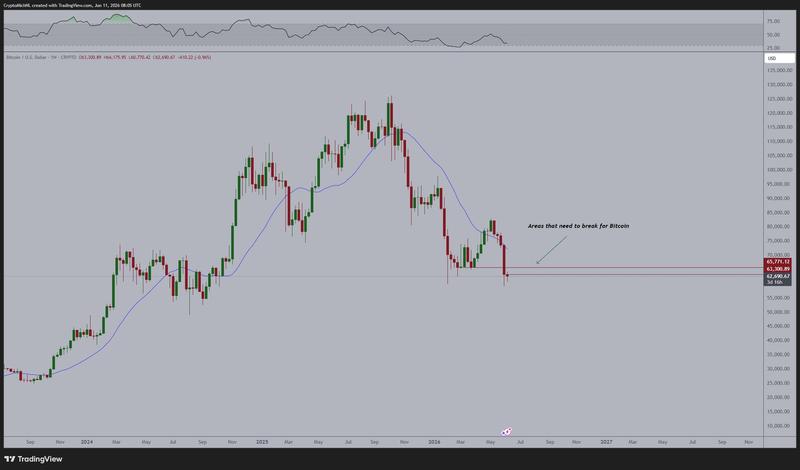
According to van de Poppe, potential upside targets aligned with the remaining CME futures gaps situated between $75,000 and $80,000, contingent upon price successfully breaking through resistance levels.