BTC Price Fluctuates Near $80K Mark as Iran Tensions Shake Cryptocurrency and Risk Markets
The $80,000 level sees renewed Bitcoin price fluctuations as geopolitical tensions involving Iran create fresh pressure on risk assets during Wall Street's opening session.

Bitcoin (BTC) experienced significant fluctuations during Monday's Wall Street opening session as recent developments in the US-Iran conflict introduced market uncertainty.
Key points:
- Bitcoin wobbles around the $80,000 mark as Iran tensions steer risk-asset markets.
- The overhead CME futures gap becomes the new target for traders wanting proof of BTC price strength.
- Short-term holders approach breakeven on their unrealized losses.
Iran injects fresh BTC price volatility with $80,000 at stake
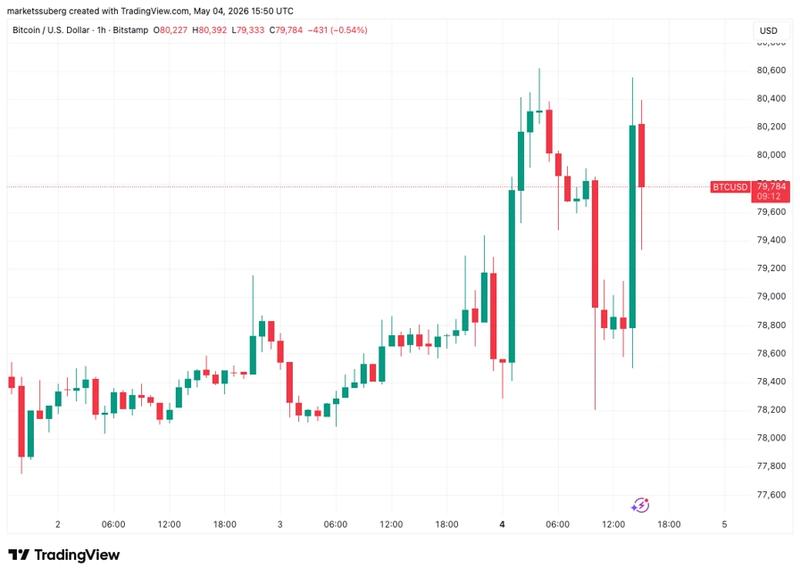
Information from TradingView revealed erratic BTC price movements as the $80,000 level emerged as a critical battleground between bullish and bearish market participants.
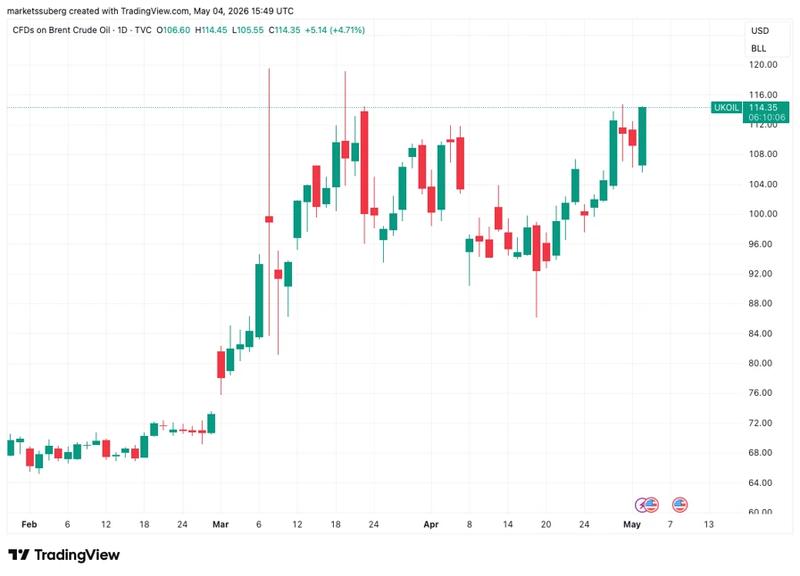
Reports emerged that Iran had launched an attack on a petroleum facility located in the United Arab Emirates, triggering a surge in oil prices throughout the trading day while US equity markets faced downward pressure.
WTI crude experienced gains exceeding 5% to climb back above $105 per barrel, meanwhile Brent reached $119 per barrel — coming close to its peak levels observed in nearly three years.
Before this, QCP Capital, a trading firm, characterized the Iran developments as "fluid."
"For now, markets appear to be pricing in de-escalation. That calculus could change quickly," it wrote in its latest Market Color analysis.
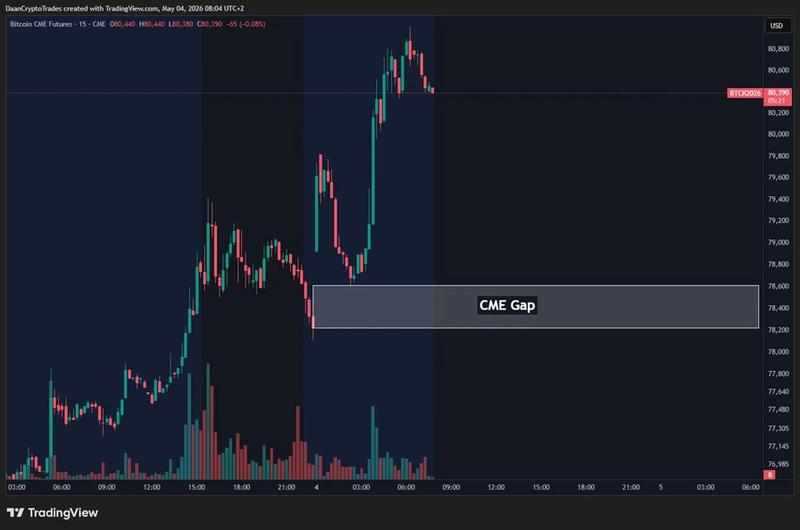
Regarding Bitcoin specifically, QCP suggested that the partially filled gap in CME Group's futures market represented the primary resistance obstacle that buyers needed to clear.
"Opened up with a new small CME gap. It is also well on its way to close the previous large gap from $84K," trader Daan Crypto Trades continued on the topic in a post on X.
"Good to mark these levels on your chart as they could act as a 'magnet' and local reversal zones if price trades close/into them."
Bitcoin speculators almost wipe out unrealized losses
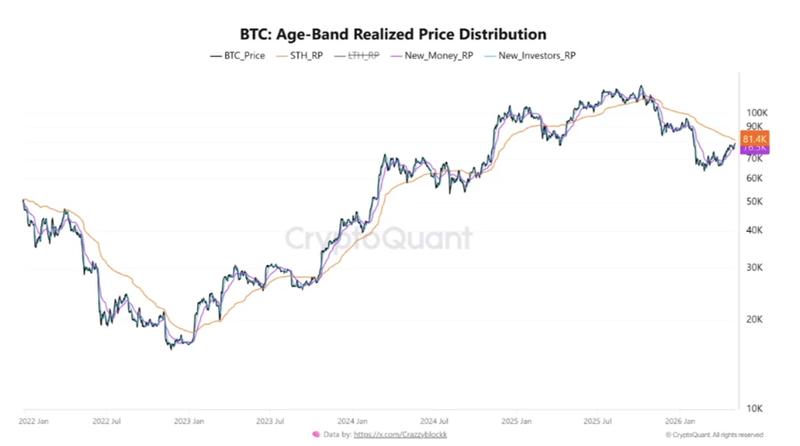
Blockchain analytics service CryptoQuant highlighted an additional significant threshold in the form of the combined cost basis of Bitcoin's short-term holders, or speculative investors holding for up to six months.
"The more probable scenario is a cautious recovery attempt toward STH realized price," contributor Crazzyblockk wrote in a QuickTake blog post.
"A confirmed daily close above $81,500 flips that level from resistance to support, opening the path toward $87–92K. Failure sends price back to test new money realized price near $76,500."
Crazzyblockk noted that Bitcoin's long-term holders remained "unbothered" about their average 27% unrealized losses.