BTC Posts Nearly 3% Daily Surge While Equities Shrug Off Iran Tensions, Crude Prices Retreat
Bitcoin managed to sidestep downward pressure following the opening of American equity markets, though experts caution that Strategy's activity accounts for a significant portion of recent BTC price momentum.
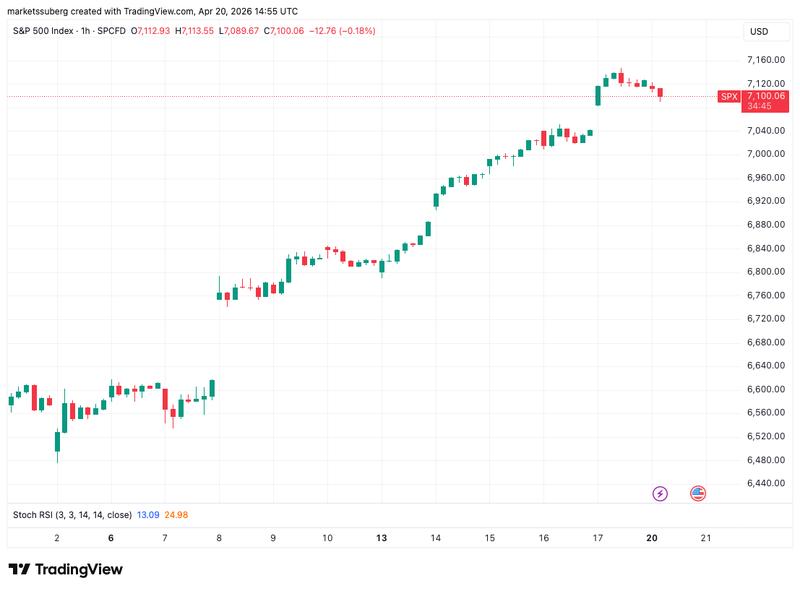
Bitcoin (BTC) recovered from earlier declines following Monday's opening bell on Wall Street as financial markets displayed minimal reaction to renewed hostilities between the US and Iran.
Key points:
- Bitcoin mirrors equities with subdued response to escalating US-Iran tensions and the blocking of the Strait of Hormuz.
- BTC price achieves over 2.5% gains on the day despite ongoing geopolitical uncertainty.
- Market analysts caution that current Bitcoin strength is predominantly fueled by Strategy's purchases and speculative activity.
BTC price maintains positive territory as market volatility remains contained
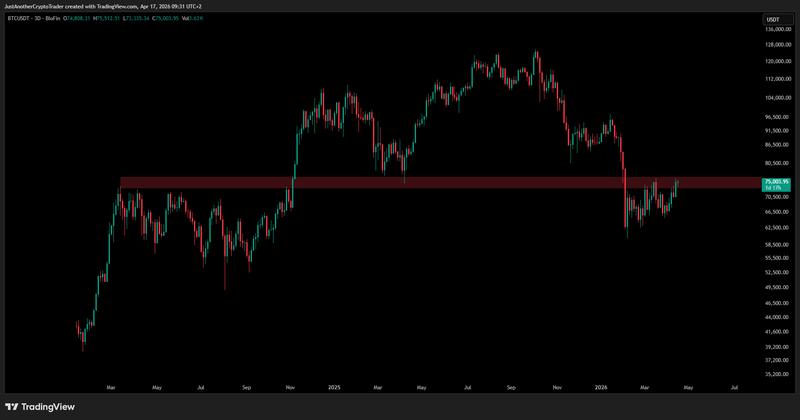
Information from TradingView indicated that BTC/USD posted 2.5% gains during the trading day, rebounding after finishing the previous week under the $74,000 level.
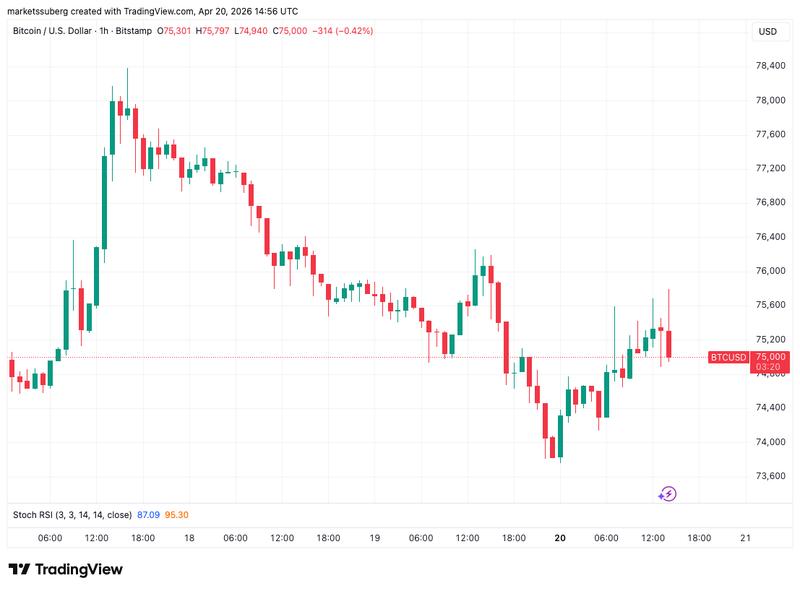
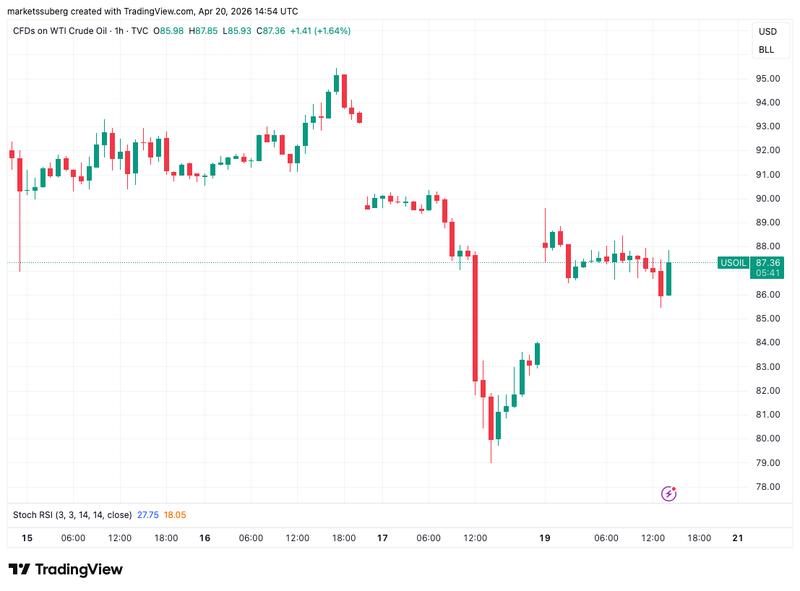
American equity indices experienced minor downward movement at the start of the trading week, though the declines were limited in scope, while crude oil prices began pulling back from an initial surge approaching the $90 mark.
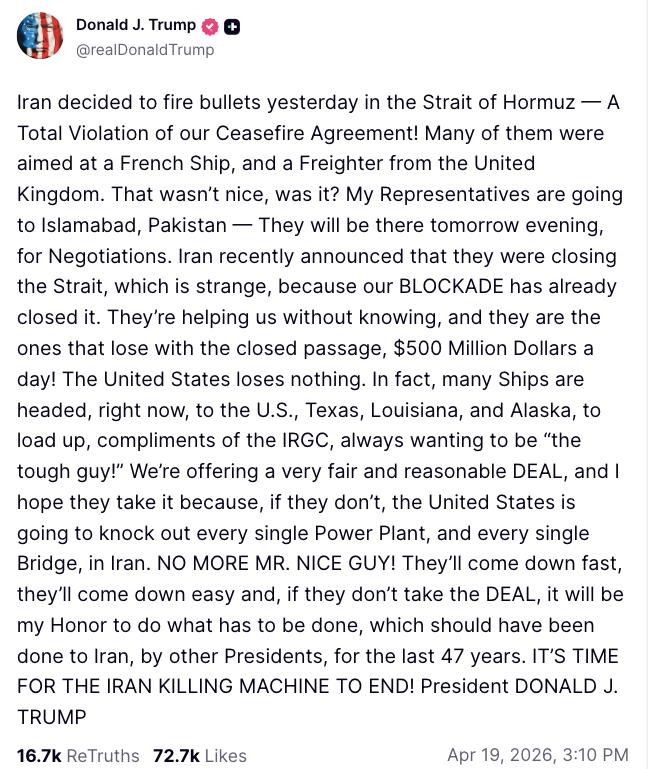
The market adjustment occurred one day following US President Donald Trump's declaration of additional diplomatic discussions concerning Iran to be held in Pakistan.
"My Representatives are going to Islamabad, Pakistan — They will be there tomorrow evening, for Negotiations," he wrote in a post on Truth Social on Sunday.
Trump seemed to downplay the importance of Iran's decision to shut down the Strait of Hormuz, characterizing the move as "strange."
In response to these developments, cryptocurrency trading firm QCP Capital indicated that financial markets had already recalibrated their projections regarding the conflict's resolution and expected duration.
"Despite the pullback in spot alongside renewed tensions, volatility has stayed notably subdued, hovering near year-to-date lows," it wrote in its latest "Market Color" update.
"This disconnect between realised risk and implied pricing suggests investors are recalibrating expectations toward a more episodic pattern of escalation: on-and-off disruptions around the Strait, paired with cycles of rhetoric and de-escalation. In effect, markets are beginning to price duration rather than intensity, pointing to a conflict that may be more protracted than initially assumed, but still contained within current bounds."
QCP further noted that despite the imminent expiration of the US-Iran ceasefire in the coming days, such a milestone would likely not prove to be a decisive turning point.
"The base case, for now, remains one of range-bound volatility, rather than a decisive breakout across major asset classes," it concluded.
Analysts scrutinize Strategy and speculator influence on price action
In his examination of near-term BTC price dynamics, J. A. Maartunn, a contributor to onchain analytics platform CryptoQuant, delivered cautionary observations for those with bullish expectations.
The recent localized peaks in Bitcoin's price action, he argued, were predominantly driven by acquisition activity from Strategy and speculative market participants, with profit-taking sellers emerging to cap the upward movement.
"Where does that leave price? Not far," he summarized in an X thread.
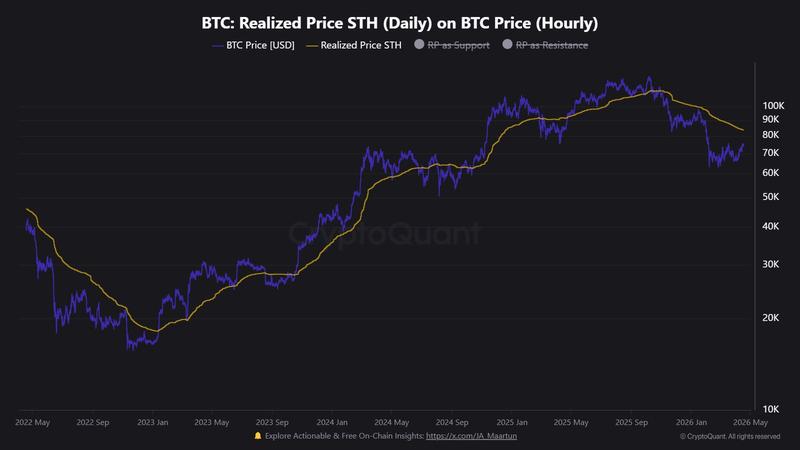
According to Maartunn's assessment, BTC/USD continues to trade beneath "key resistance" levels, notably the cost basis of short-term holders (STHs) positioned around the $83,000 threshold.
"Long-Term Holders keep accumulating, and Strategy isn't done yet," he acknowledged.
"The key question: is it enough to push Bitcoin higher? For now, this still looks like a bear market rally… But a strong breakout could quickly shift the trend."