BTC Plummets Below $79K Mark as Treasury Yields Trigger 3% Cryptocurrency Decline
Bitcoin continues its downward trajectory as rising U.S. treasury yields ignite risk-asset liquidation, with market participants anticipating further BTC price declines ahead.
Bitcoin (BTC) slipped beneath the $80,000 threshold as Wall Street trading commenced on Friday, with market analysts attributing the weakness in risk assets to developments in United States bond markets.
Key points:
- Bitcoin targets its weakest price points of May amid mounting worries over U.S. treasury yields triggering a broader risk-asset selloff.
- The yield on U.S. 10-year treasuries climbs past threshold levels that previously prompted a U.S. tariff suspension on China in the prior year.
- Market participants anticipate additional local price minimums for BTC/USD as foundational support continues to deteriorate.
Bitcoin experiences pain as risk-asset "euphoria" evaporates
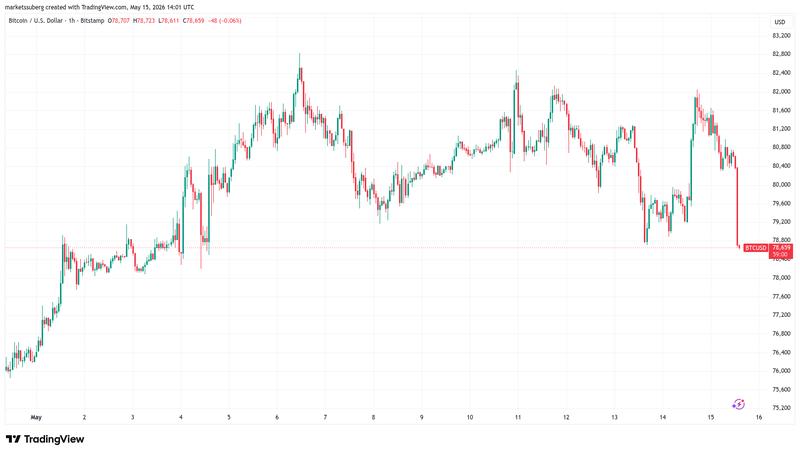
Information from TradingView documented BTC price declines of 3% over the daily timeframe, with the downward pressure accelerating upon commencement of the U.S. trading session. The BTC/USD pair moved toward its weakest price levels witnessed thus far in May.
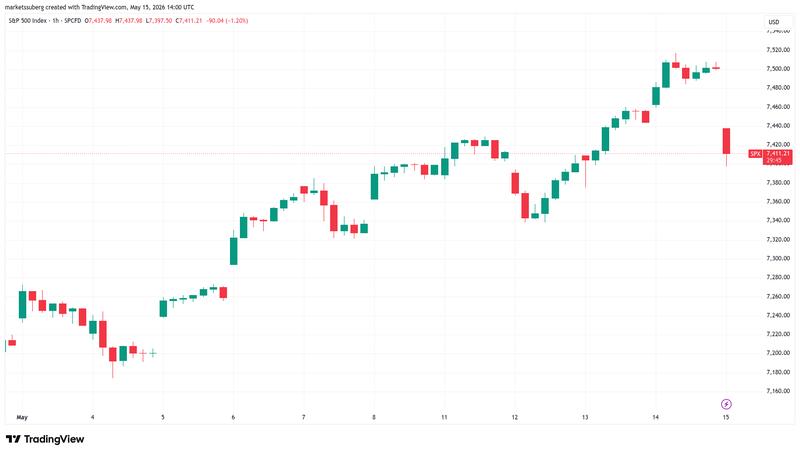
Equity markets similarly surrendered previous gains following their achievement of fresh all-time peaks earlier during the trading week.
In response to these market movements, trading resource The Kobeissi Letter observed risk-asset "euphoria" transitioning into anxiety regarding "unsustainable" United States bond yields.
"The bond market crisis is intensifying. The US 10Y Note Yield is now officially above 4.55% for the first time since May 2025," it wrote in a post on X.
After weeks of euphoria, the market is beginning to react today. As we have been stating for the last few weeks, the current situation in the bond market is unsustainable.
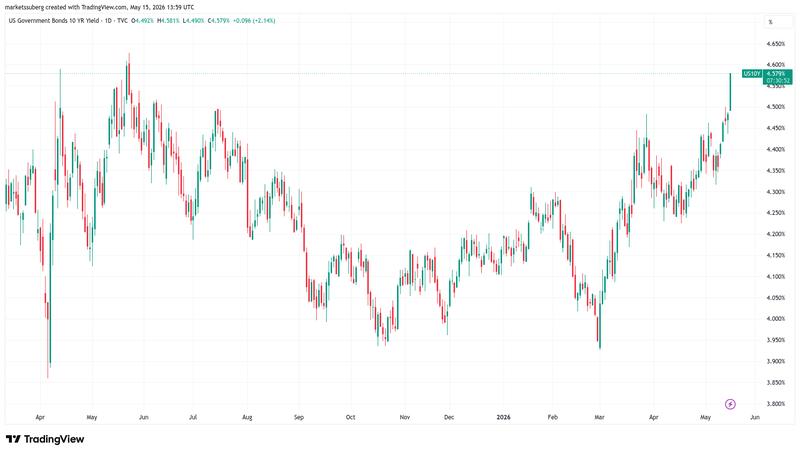
Kobeissi highlighted that current yield levels had surpassed those observed during April 2025, the period when United States President Donald Trump suspended the rollout of trade tariffs targeting China. According to their analysis, that decision was made in response to "a collapsing bond market."
"Furthermore, the market now sees a 60%+ chance that the Fed's next move is an interest rate HIKE, with rate cuts entirely priced-out," the post added.
We expect to see 7%+ mortgages next, all as auto loan delinquencies have reached 32-year highs. Inflation is back and higher rates are coming.
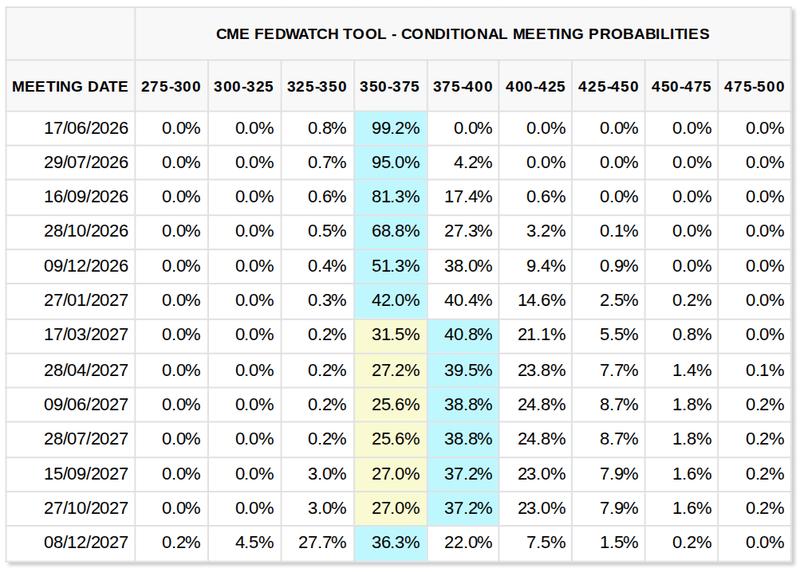
The most recent information from CME Group's FedWatch Tool indicated that a 0.25% interest-rate hike represented the most probable result by March 2027.
BTC price lows return to focus
As previously covered by Cointelegraph, market traders had already expressed skepticism regarding Bitcoin's capacity to advance past the $82,000 local high zone.
A test of support levels was already being anticipated, with downside targets for the trading day reaching into the middle $70,000 range.
"Honestly, not a good sign that $BTC fully retraced the move from yesterday," trader Pat told X followers.
Continuation within a defined range was becoming a progressively favored scenario, with market analyst Eric Coleman proposing that lower-time frame price behavior remained predictable.
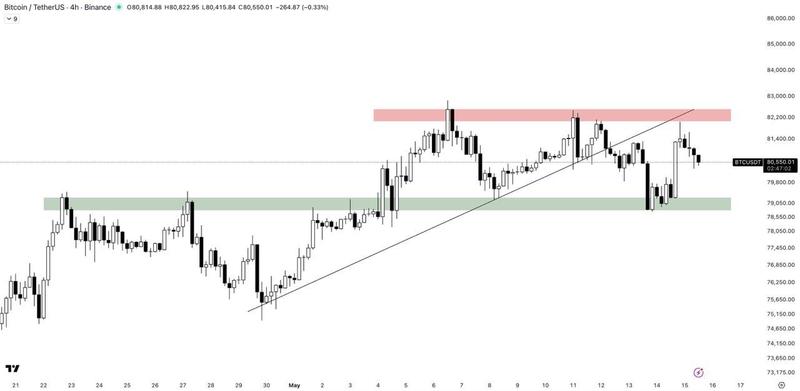
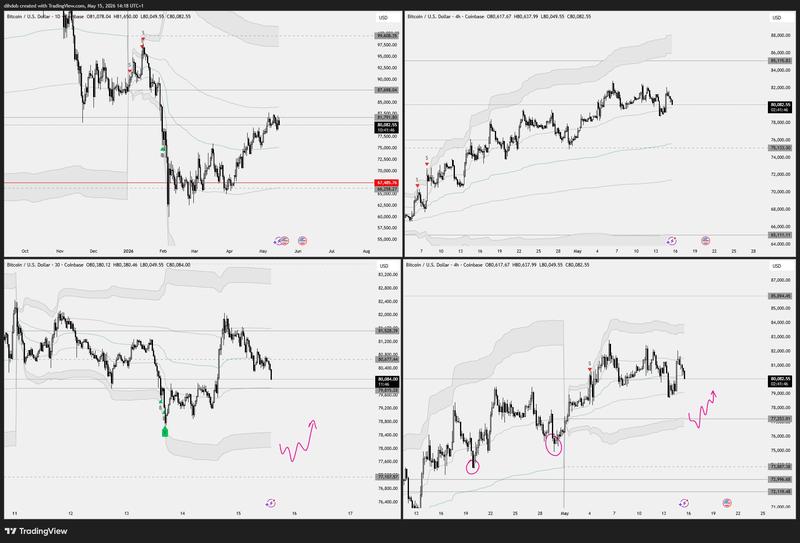
"BTC pumped from the marked horizontal support just as expected and again it got rejected below the trendline and the horizontal resistance," he wrote alongside an explanatory chart.
Further movement in between the horizontal support and resistance is expected until a solid breakout or breakdown occurs.