BTC Mayer Multiple Plunges to Bear Market Territory: Analyzing Bitcoin's Potential Price Floor
Bitcoin's Mayer Multiple indicator has fallen to 0.65, mirroring the severe bearish market environment of 2022 and igniting discussion about whether the actual floor for BTC sits at $50,000 or even deeper levels.

According to a widely-followed BTC price metric that has plunged to levels not witnessed in nearly four years, Bitcoin (BTC) has now reached the "darkest days" phase of its bear market pullback.
Key takeaways:
- The Bitcoin Mayer Multiple indicator has declined to 0.65, replicating the extreme bear market depths witnessed in May 2022.
- Should the 2022 pattern repeat itself, BTC could experience further declines reaching as low as $40,000.
Mayer Multiple indicator drops back to May 2022 territory
The dramatic 45% plunge in Bitcoin from its $126,000 all-time high has brought onchain metrics into sharp focus as traders and investors attempt to identify where the BTC price will likely find its floor.
Among the various indicators pointing toward a potential bottom forming in the near term is the Mayer Multiple.
On Tuesday, in a social media post on X, analyst On-Chain College noted that the Bitcoin Mayer Multiple metric had declined to levels "usually reserved for deep bear market corrections."
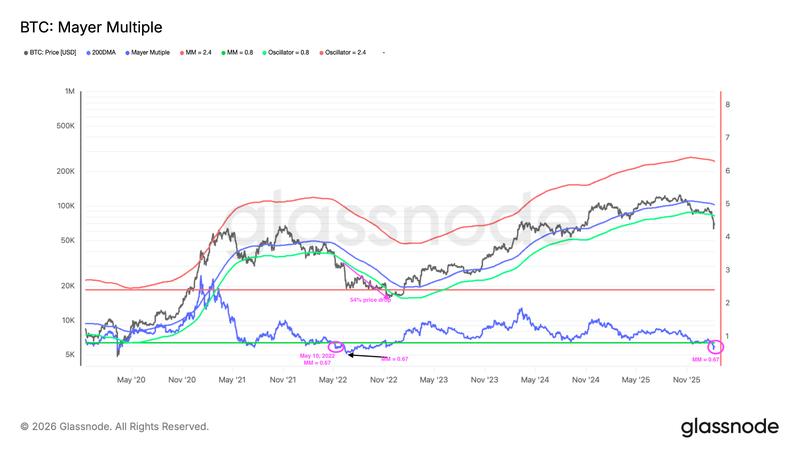
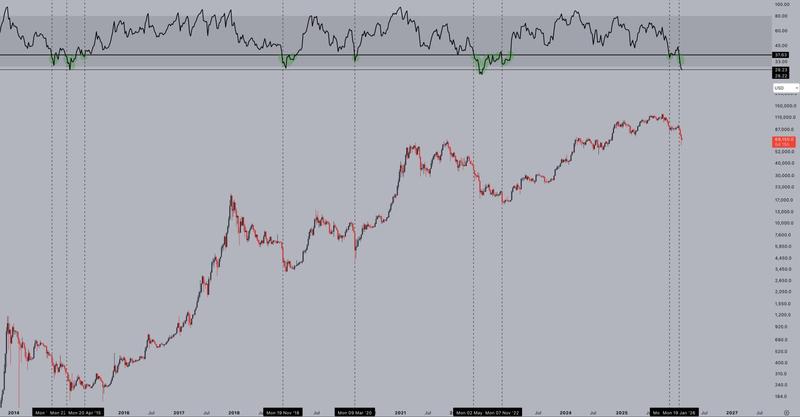
This technical indicator compares Bitcoin's current market price to its 200-day moving average, with the calculated ratio serving as either a buy or sell signal. Trace Mayer, who developed the indicator, initially established a threshold below 2.4 as "buy" zone, represented by the red line in the accompanying chart.
According to data from Glassnode, a leading on-chain analytics platform, the Mayer Multiple registered at 0.65 as of Feb. 9, falling beneath its "oversold" threshold of 0.8 (indicated by the green band), a level not observed since May 2022.
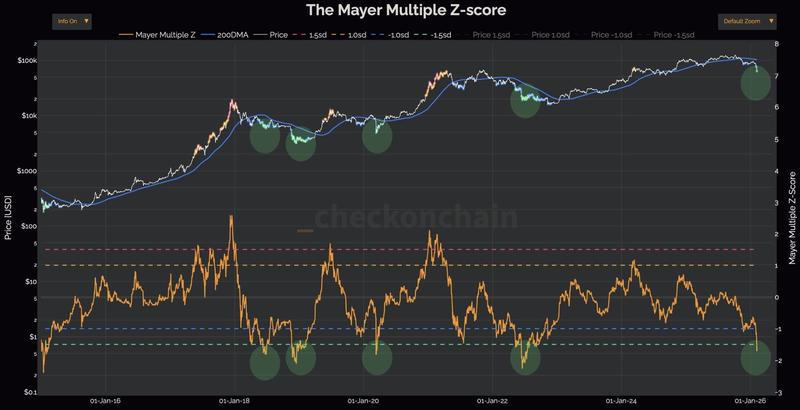
"Bitcoin is now officially under the green band of the Mayer Multiple Z-Score, which is usually reserved for deep bear market corrections," On-Chain College explained, further stating:
"It can still take months before finding a bottom, but BTC is in a period in history typically reserved for the darkest days of bear markets."
Throughout Bitcoin's history, readings such as these have typically signaled some of the most favorable long-term accumulation opportunities.
According to analyst CryptosRus in a Sunday post on X, a Mayer Multiple reading of 0.6 indicates that Bitcoin is currently trading 40% beneath its 200-day MA, further commenting:
"This doesn't happen during normal pullbacks. It only shows up during full-blown capitulation."
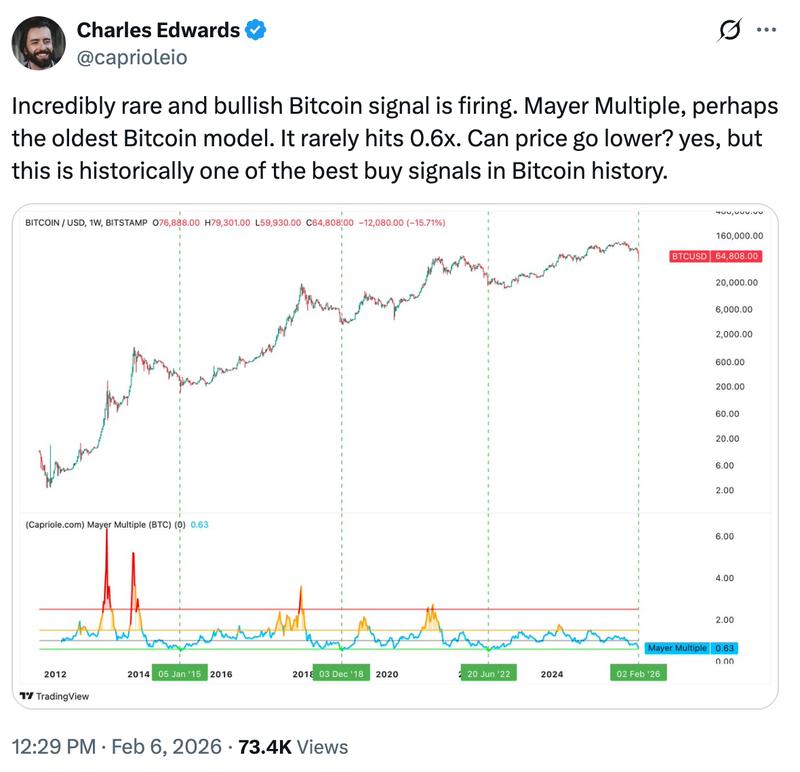
"Historically, being below this level is exactly where I want to be stacking," commented analyst On-Chain Mind, while Charles Edwards, founder of Capriole Investments, remarked:
"This is historically one of the best buy signals in Bitcoin history."
However, extreme lows registered in the Mayer Multiple don't necessarily align with BTC price bottoms in every instance. During mid-2022, this indicator reached its nadir at approximately 0.47. Yet the BTC/USD trading pair subsequently fell an additional 58% throughout the next four months before ultimately finding its floor at $15,500.
Identifying Bitcoin's actual bottom level
As previously covered by Cointelegraph, whether Bitcoin price has already established its bottom beneath $60,000 continues to be a subject of active debate, as multiple metrics still indicate that BTC's downward trajectory may continue.
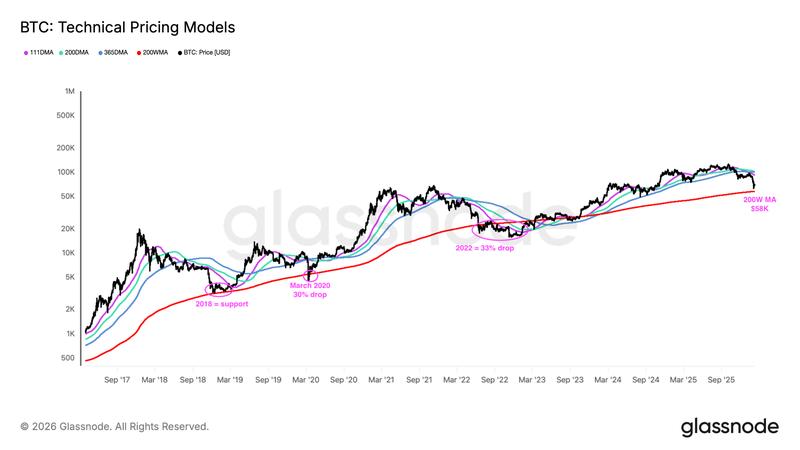
The 200-week MA, presently positioned at $58,000, is frequently regarded as the definitive support threshold for Bitcoin during bearish market cycles. This price level sits roughly 15% beneath the current market price.
Looking at historical patterns, BTC/USD has declined to this threshold during severe bearish environments, though it has seldom broken below it with the exception of 2020 and 2022, during which losses averaged approximately 30%.
Consequently, Bitcoin may experience further downside to retest the 200-day MA positioned at $58,000, though in more extreme scenarios, it could decline another 30% approaching the $40,000 price zone.
This price target appears reasonable when examining the relative strength index (RSI), which maintains room to decline another 55% from its current 37 reading, potentially bringing Bitcoin into the lower $40,000 range, according to analyst Jelle in a recent X post analysis.
Looking at historical precedent, previous lows have exhibited less severity, rendering 55% an "extreme" decline, the analyst explained, noting that a 40% drop below the RSI's 37 level would align with the previous two bottoming patterns, suggesting a price around $52,000 prior to summer.
"There's decent confluence around that area for me to at least pay close attention to the low $50Ks."
According to previous Cointelegraph reporting, Bitcoin could establish a "real bottom" in the vicinity of $50,000 should the 2022 bear market pattern repeat itself.