BTC Market Eyes Rapid Rally to $90K After CLARITY Act Decision
Market participants monitor the CLARITY Act decision and diminishing pressure from short-term holders as Bitcoin remains under the $80,000 mark.


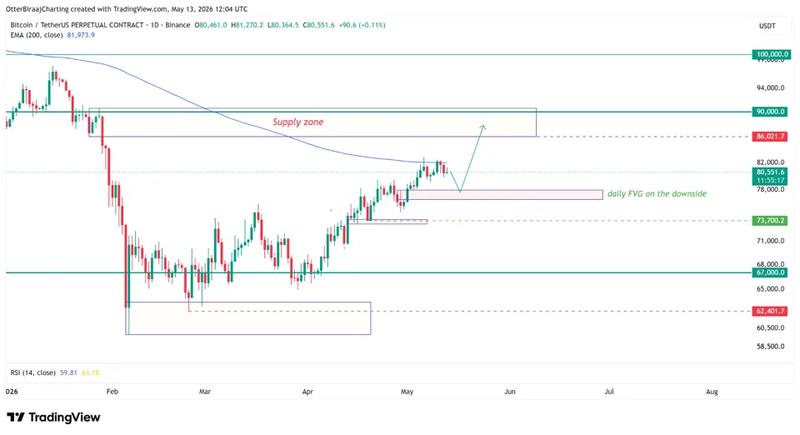
Market participants trading Bitcoin (BTC) anticipated a rapid upward movement approaching $90,000 following Thursday's scheduled CLARITY Act vote, with enhanced market fundamentals and reduced selling pressure from short-term investors creating favorable conditions for an upside breakout.
Bitcoin market signals potential breakout above $80,000
Throughout the previous week, Bitcoin has fluctuated near the $80,000 price point, with the 200-day exponential moving average (EMA) serving as a critical resistance level overhead. Between $79,000 and $78,000, more than $3 billion worth of leveraged long positions have accumulated, indicating that BTC might temporarily revisit this price zone before making another attempt to break through the 200-day EMA barrier.
Michaël van de Poppe, who founded MN Capital, maintained an optimistic outlook and stated,
"If this continues to grind upwards, with the upcoming CLARITY Act tomorrow, I would assume we might see a fast move to $90K in a matter of days for Bitcoin."
Data from blockchain analysis also indicates strengthening market fundamentals. According to Bitcoin researcher Axel Adler Jr., short-term holder loss pressure has stayed at zero percent for a consecutive five-day period. This particular metric evaluates whether Bitcoin purchasers who recently entered the market are maintaining positions below their original acquisition cost.
Adler Jr. further observed that the portion of Bitcoin supply in the hands of short-term traders declined to 22.2%, representing its lowest point over the past 90 days. This development implies that fewer recently acquired BTC units are entering the market, potentially increasing the likelihood of an upward price breakthrough.

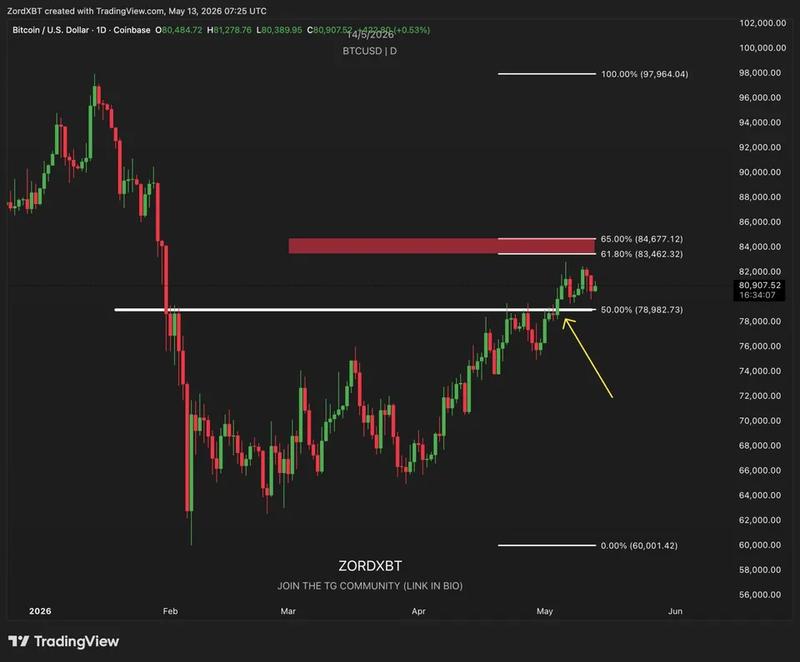
Nevertheless, cryptocurrency trader Zord cautions that Bitcoin may encounter resistance within the $83,400 to $84,600 range following a successful reclaim of the 50% Fibonacci retracement level situated around $78,983.
Based on the technical chart analysis, the $83,400–$84,600 zone represents the subsequent Fibonacci resistance area of 0.618-0.65, a level where market participants might initiate profit-taking activities and potentially decelerate Bitcoin's upward momentum.
CLARITY ACT vote draws market attention
The CLARITY Act represents a proposed piece of US legislation designed to establish more transparent guidelines for regulatory oversight of the cryptocurrency market and stablecoins.
According to Cointelegraph's reporting, US Senate Banking Committee members filed over 100 amendments to the proposed legislation prior to Thursday's scheduled discussion. The majority of these suggested modifications concentrate on stablecoins, cryptocurrency developers, and matters related to ethics.
A leaked version of the legislation that emerged on Monday indicates that cryptocurrency exchanges along with other platforms might no longer have authorization to provide stablecoin rewards that function similarly to interest earned through conventional savings accounts.
According to crypto research firm XWIN Japan, the proposal seems designed to create a distinction between stablecoins utilized for payment transactions and financial products that exhibit characteristics more similar to traditional bank deposits.
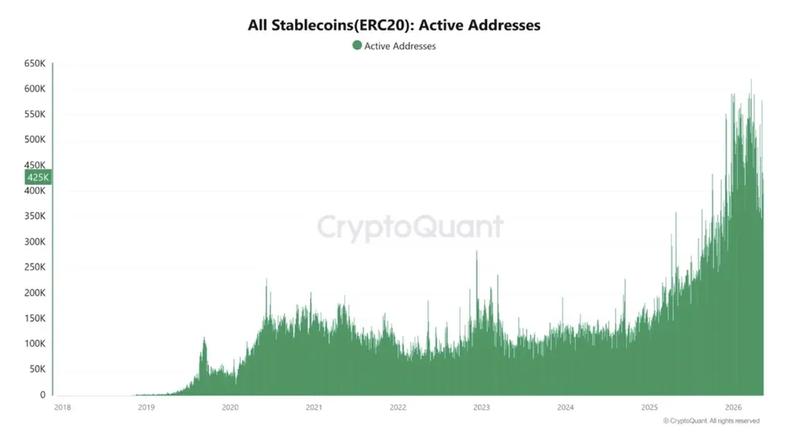
In the meantime, stablecoin usage and adoption have demonstrated continuous expansion throughout cryptocurrency networks. As an illustration, ERC-20 stablecoin active addresses have exhibited parabolic growth patterns over recent years.
XWIN Japan further noted that stablecoins continue to represent the primary source of capital flow within crypto markets, and broader acceptance of stablecoins alongside blockchain-based financial instruments could provide support for increased long-term capital allocation into Bitcoin.