BTC Faces Potential Drop to $30K as Institutional Investors Sell 450% of Daily Mining Output
Institutional backing for Bitcoin eroded as exchange-traded funds and corporations sold nearly 2,000 BTC each day while Strategy's acquisition pace slowed significantly.

A fresh analysis suggests Bitcoin (BTC) is now confronting heightened dangers of a collapse toward the $30,000 level as institutional appetite has shifted sharply into negative territory.
Key takeaways:
- Current data indicates institutional players are selling approximately 450% of the BTC mined daily.
- The cryptocurrency faces the threat of falling beneath $30,000 should demand fail to absorb excess supply.
Daily institutional selling approaches 2,000 BTC
The institutional buying model developed by Capriole Investments, which monitors Bitcoin acquisitions from exchange-traded funds, corporate balance sheets, and miner production, reveals net institutional distribution at approximately 450% of the daily mining rate, which translates to roughly 2,000 BTC each day.
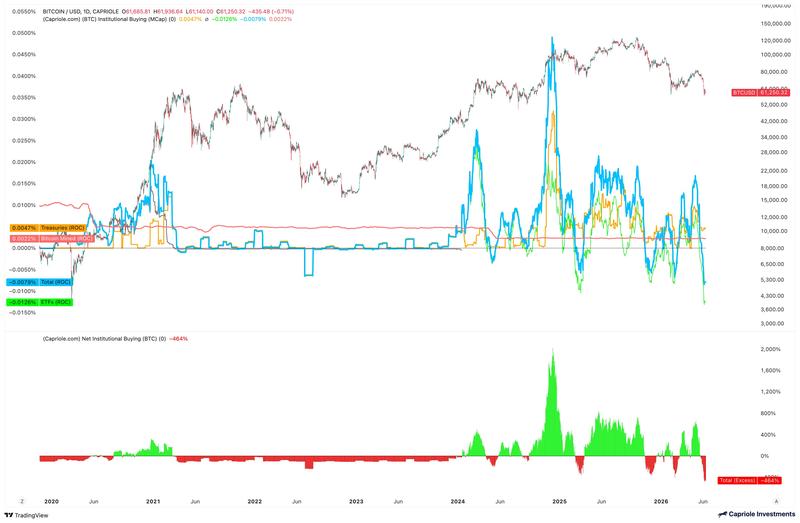
Put differently, major institutional participants are offloading Bitcoin at a rate 4-5 times higher than the daily mining output.
Spot Bitcoin exchange-traded funds seem to represent the most significant source of pressure. The flow trajectory for these instruments has plunged deeply into negative territory, indicating that ETF redemptions are currently overpowering all other demand channels.
Over the last 30 days, these investment vehicles have experienced approximately $27 billion in net outflows, based on information from data analytics platform Glassnode.
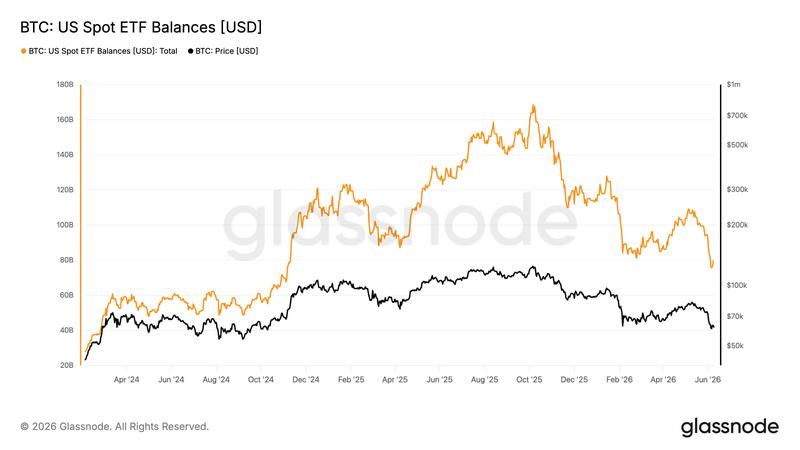
This represents a dramatic shift from the pattern observed during 2024–2025, when incoming capital to ETFs contributed to driving Bitcoin toward all-time peak values.
Strategy's deceleration presents vulnerability
Strategy, led by Michael Saylor, served as a stabilizing force for Bitcoin's institutional appetite during the early part of 2026, acquiring 89,599 BTC throughout Q1 by itself.
The firm continued its accumulation campaign into Q2, purchasing an additional 62,300 BTC by late May, which included a substantial single acquisition of 24,869 BTC executed in mid-May. These transactions brought the company's total holdings beyond the 843,000 BTC threshold.
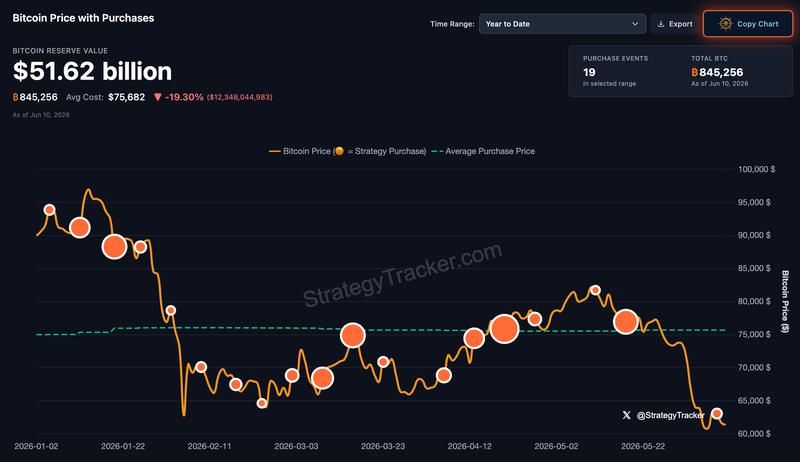
This accumulation phase aligned with BTC's approximately 40% recovery from its 2026 bottom of $59,930, strengthening the perception that corporate balance sheet acquisitions represented one of the market's most reliable support mechanisms throughout the rebound phase.
Nevertheless, the company's most recent acquisition activity has decelerated dramatically, with merely a 1,550 BTC purchase recorded in early June following a minor 32 BTC sale executed to satisfy preferred-stock dividend obligations.
Strategy's current buying rate falls significantly short of its Q1 and early Q2 velocity, and the purchases are insufficient to offset ETF-driven selling momentum, which Capriole's analytical framework places at approximately 2,000 BTC daily.
Analyst cautions Bitcoin could descend toward $30,000 or beyond
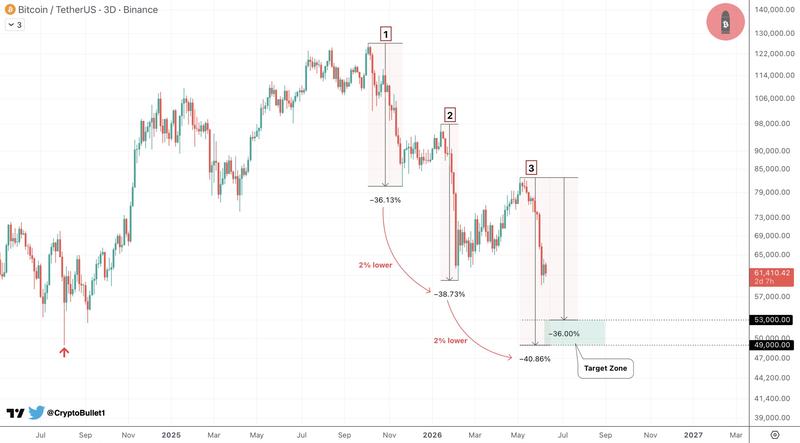
The current downward movement for BTC could mirror its prior corrections of 36%–39%, which would place the subsequent bearish objective within the $49,000–$53,000 price corridor, as outlined by analyst CryptoBullet.
While that region could provide preliminary resistance to further declines, analyst Jelle's Fibonacci-based framework indicates it might not represent the ultimate bear-market base.
In a post published Wednesday, he observed that each BTC bear cycle has descended substantially beneath its 0.618 Fibonacci retracement level prior to establishing a bottom. Historical precedent shows BTC declined 65% below the 0.618 threshold during 2014–2015, dropped 59% in 2018 and fell 44% in 2022.
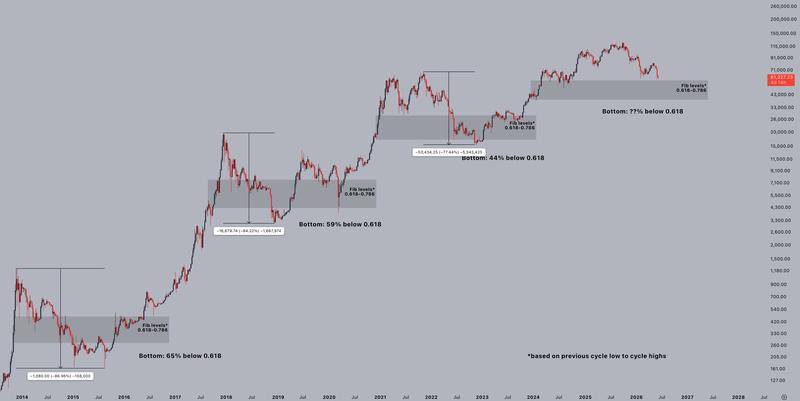
Given that Bitcoin's present 0.618 retracement sits around $57,000–$58,000, even if the decline matches the more moderate 2022 correction pattern, it would suggest a possible floor in the vicinity of $32,000.
More severe corrections resembling the 2018 and 2015 patterns would project potential bottom formations toward $23,000–$24,000 and $20,000, respectively.