BTC experiences month-end turbulence as 30-year Treasury yields approach two-decade peak
As the monthly candle closure approaches, Bitcoin experiences price swings while Treasury Secretary Scott Bessent addresses the bond market situation.

As Wall Street commenced trading on Monday, Bitcoin (BTC) fluctuated in the vicinity of $78,000 while US bond yields approached their highest levels in two decades.
Key points:
- Bitcoin experiences price movement following the US Treasury Secretary's mainstream media interview regarding bond markets.
- Market observers caution that bonds are "ignoring" policy adjustments as the 30-year yield approaches new 20-year peaks.
- Technical analysis of BTC price reveals a developing hidden bearish RSI divergence that may be contributing to end-of-month weakness.
Bessent's bond yield commentary triggers Bitcoin volatility
According to TradingView data, BTC/USD fluctuated within a tight trading band, posting approximately 1% gains during the trading session.
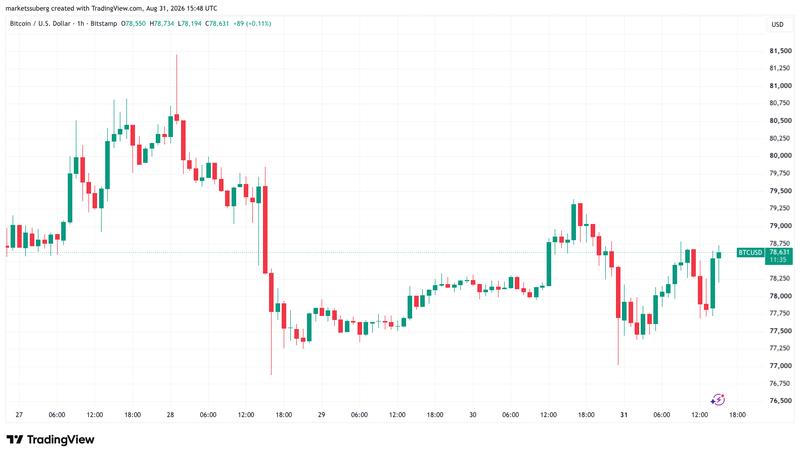
Following an initial decline at the opening of US market hours, the cryptocurrency pair experienced a rapid recovery when US Treasury Secretary Scott Bessent suggested the possibility of additional interventions in the US bond market. During a CNBC interview, Bessent emphasized that he had yet to take action to support the longer end of the yield curve — specifically 10-year and 30-year bonds.
"I haven't bought anything yet," he informed the network, further stating that he was "fine" with yields recovering following the announcement.
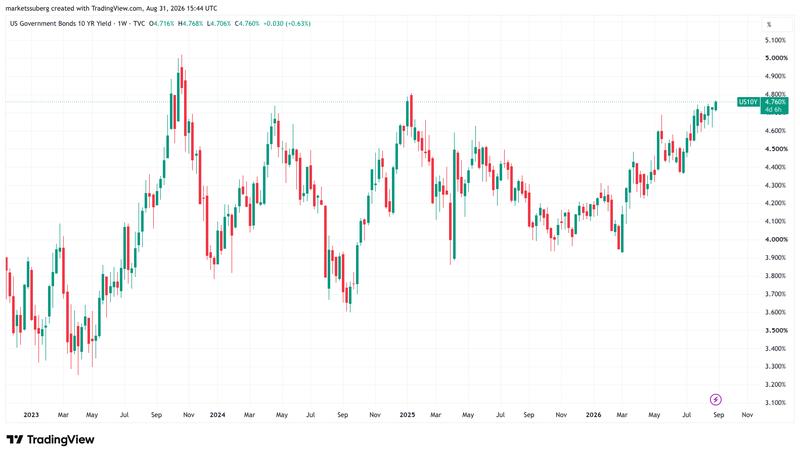
Earlier this month, the Treasury revealed plans to increase its debt buyback transactions to a minimum of $4 billion starting in September, more than doubling the previous size. While yields initially declined following this announcement, Monday saw the 10-year yield return to its peak levels since January 2025, reaching 4.76%.
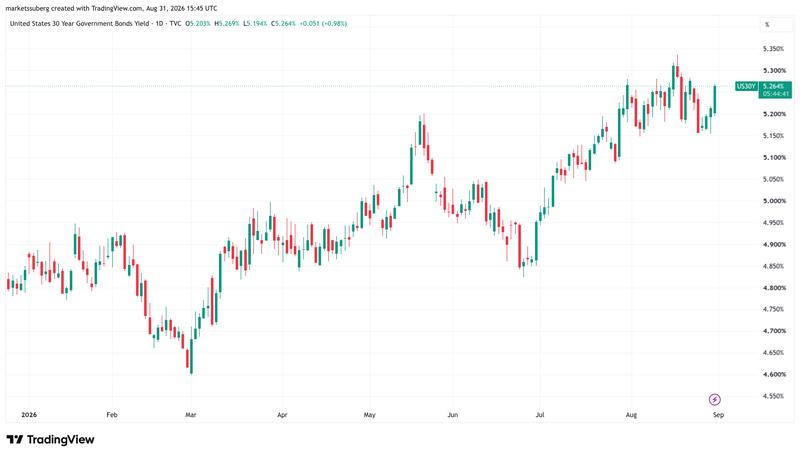
Throughout the day, the 30-year yield climbed to 5.269%, coming within six basis points of its peak levels last observed in January 2007.
"The bond market appears to be completely ignoring the US Treasury," trading resource The Kobeissi Letter responded in a post on X.
In earlier commentary, Ray Dalio voiced doubts regarding the Treasury's capacity to manage bonds, even with the newly implemented program. While projecting a potential US debt crisis in the future, he identified both Bitcoin and gold as viable hedging instruments.
"As general advice, I suggest diversifying well in asset classes and countries that have strong income statements and balance sheets and are not having great internal political and external geopolitical conflicts, underweighting debt assets like bonds, and overweighting gold and a bit of Bitcoin,"
he wrote in a post on LinkedIn.
Meanwhile, US equity markets remained in negative territory throughout the day, with the S&P 500 and Nasdaq Composite Index both declining approximately 0.4% as concerns regarding fresh US-Iran military strikes impacted market sentiment.
Bearish RSI divergence emerges in Bitcoin technical analysis
With the August monthly candle close approaching, BTC/USD continued to hold its 50-week exponential moving average (EMA) at $77,269 as a key support level.
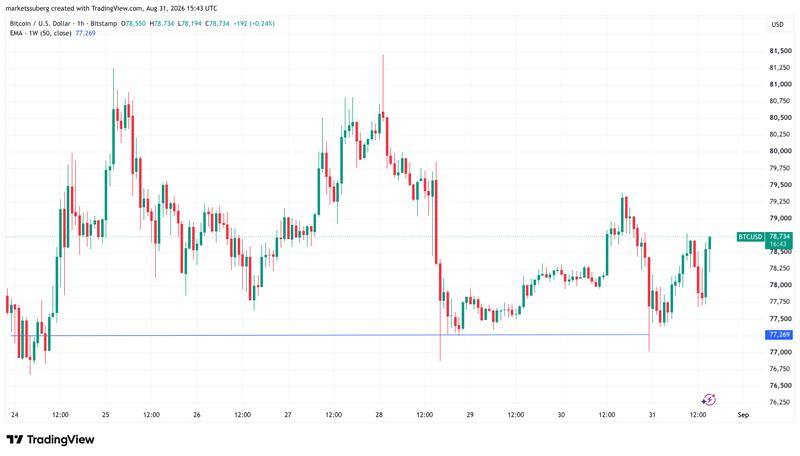
As Cointelegraph previously reported, this particular level represents a critical threshold for bullish market participants. Month-to-date performance has approached 25% gains, marking Bitcoin's strongest August showing since 2017.
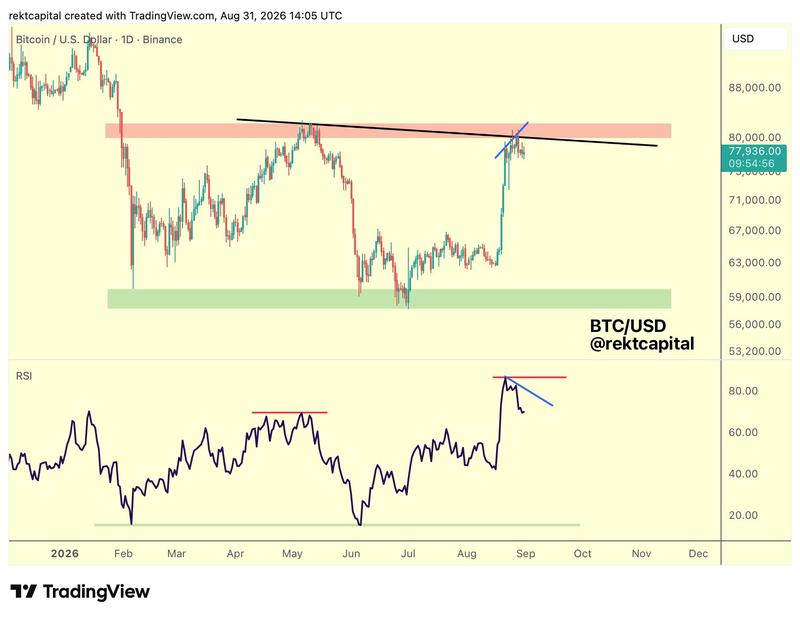
Sounding a cautionary note, trader and analyst Rekt Capital identified a hidden bearish divergence emerging on daily timeframes between price action and the relative strength index (RSI). While weekly RSI readings suggested bullish momentum, he cautioned that the most recent daily values indicated diminishing strength.
"if the Daily RSI continues to make Lower Highs (blue), that'll contribute to mounting weakness here," he told X followers alongside an explanatory chart.
On Monday, daily RSI registered a reading of 70.7, maintaining its position within "overbought" territory.