BTC Drops to Seven-Day Bottom as Oil Surges Past $100, Triggering Asian Market Concerns
The world's leading cryptocurrency dips below the $76,000 mark, reaching its lowest point in seven days amid escalating concerns over crude oil costs and the Hormuz Strait closure.

The leading cryptocurrency Bitcoin (BTC) tumbled to its lowest levels in seven days following the opening of Wall Street trading on Tuesday, as concerns over oil supply disruptions sent shockwaves through international financial markets.
Key points:
- The flagship cryptocurrency maintains its retreat from recent peak levels as renewed concerns about oil exacerbate already fragile investor confidence.
- President Donald Trump of the United States refrains from providing clarity on whether the Strait of Hormuz blockade will be resolved.
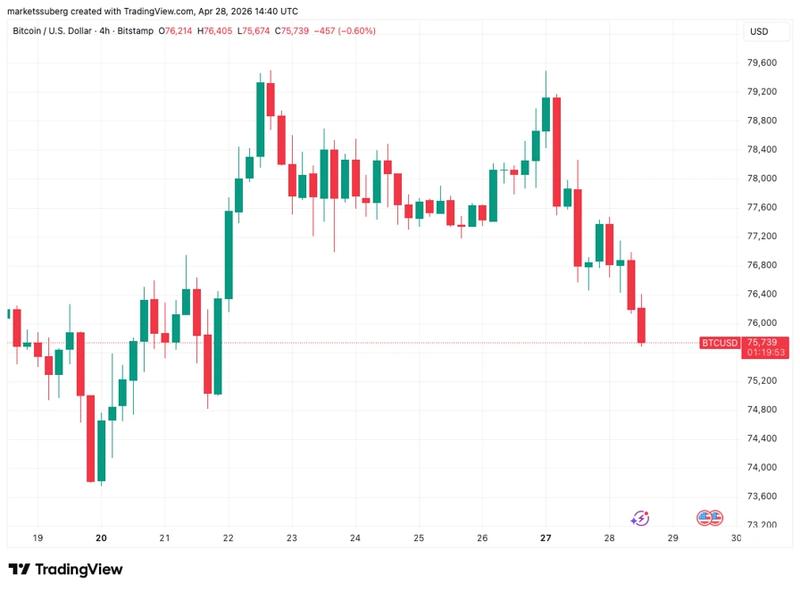
- The cryptocurrency's value drops beneath the $76,000 threshold, erasing gains accumulated throughout the week.
Cryptocurrency and equities deepen decline amid Hormuz crude oil anxiety
Information from TradingView revealed BTC/USD sliding beneath the $76,000 level while American equity markets simultaneously commenced trading in negative territory.
The conflict between the United States and Iran served as the fundamental catalyst behind the retreat in risk-oriented assets, with crude oil commanding primary attention due to the continued closure of the Strait of Hormuz.
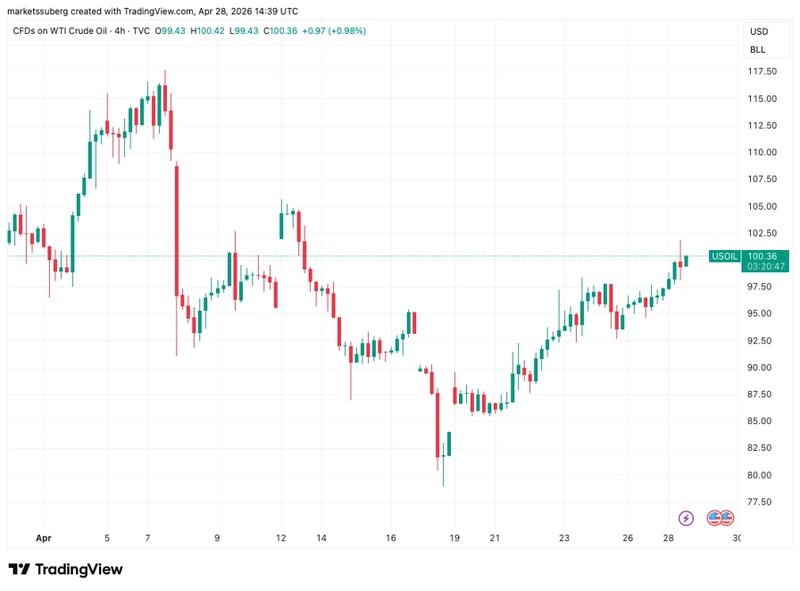
WTI crude oil prices climbed back to the $100 per barrel threshold during the trading session, while US President Donald Trump persistently maintained uncertainty regarding the resolution of the Hormuz crisis.
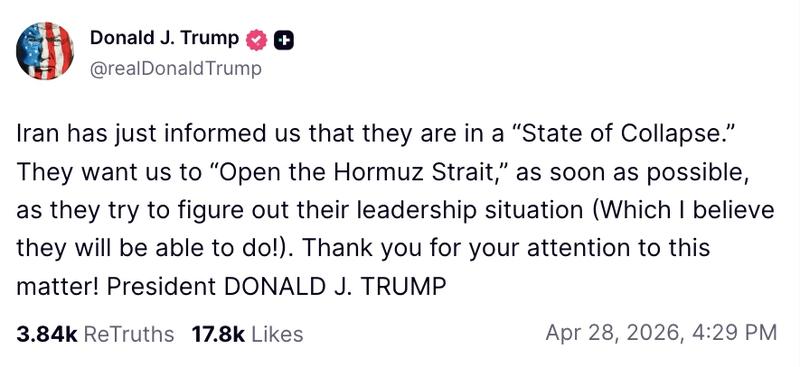
"Iran has just informed us that they are in a 'State of Collapse,'" he wrote in a post on Truth Social.
They want us to 'Open the Hormuz Strait,' as soon as possible, as they try to figure out their leadership situation (Which I believe they will be able to do!).
Providing analysis, the trading resource The Kobeissi Letter highlighted the continued ramifications for nations across Asia, with Iran's oil storage facilities approaching maximum capacity at an accelerating rate.
"Asia's energy crisis will soon intensify even further," it predicted in a post on X.
Cryptocurrency analysts similarly highlighted the influence of crude oil prices on overall market sentiment, including representatives from onchain analytics platform Glassnode.
"Disruptions in the Strait of Hormuz persist due to stalled US-Iran talks, tightening supply and spooking markets across the board," it told X followers on the back of the WTI jump.
Expectations of BTC price surge diminish approaching month's end
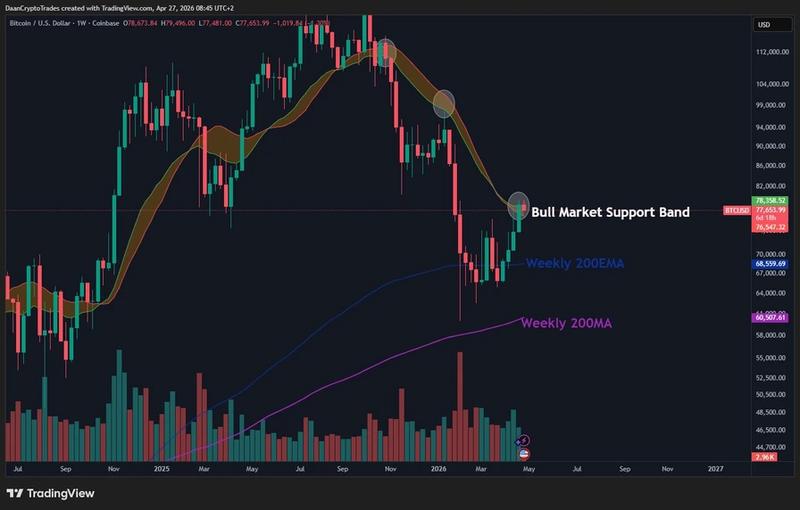
The price movement of BTC therefore remained hesitant to challenge the $80,000 threshold following the confirmation of a weekly candlestick closure positioned above a critical resistance trendline.
Conversely, the two most recent descents toward $73,000 caused market observers to exercise caution before declaring the emergence of a "double bottom" pattern prematurely.
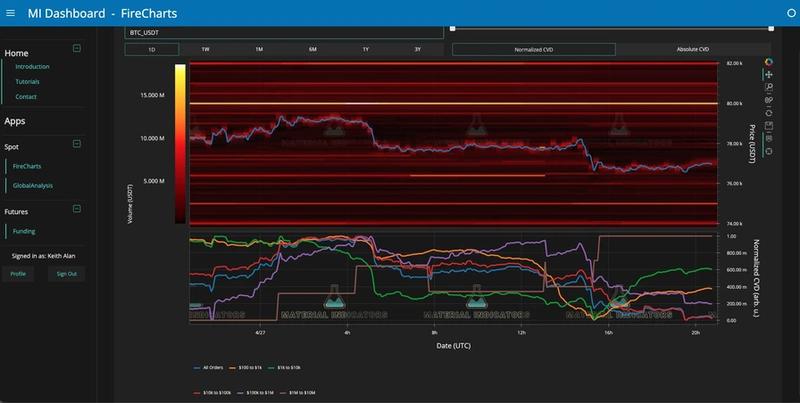
"So far, $BTC bulls aren't showing much enthusiasm for a robust double bottom bounce. Expecting to see volatility increase as we move to and through the monthly close," trading resource Material Indicators commented.
An accompanying chart showed exchange order-book liquidity and whale orders, with only the largest class of investors stepping in to buy.
Additional market observers similarly insisted upon greater evidence demonstrating that bullish forces possessed the strength to overcome the numerous resistance zones positioned directly above the current spot price, including the bear market support band.
"We'll need to see follow up to actually confirm a proper breakout though. But at least the bulls are putting in an effort for now," trader Daan Crypto Trades wrote on X.