BTC Dips Below $60K Mark While Market Eyes 15% Recovery Rally
The cryptocurrency's value slipped beneath the $60,000 threshold for the first time in several weeks, yet market indicators reveal traders are positioning for a relief rally.

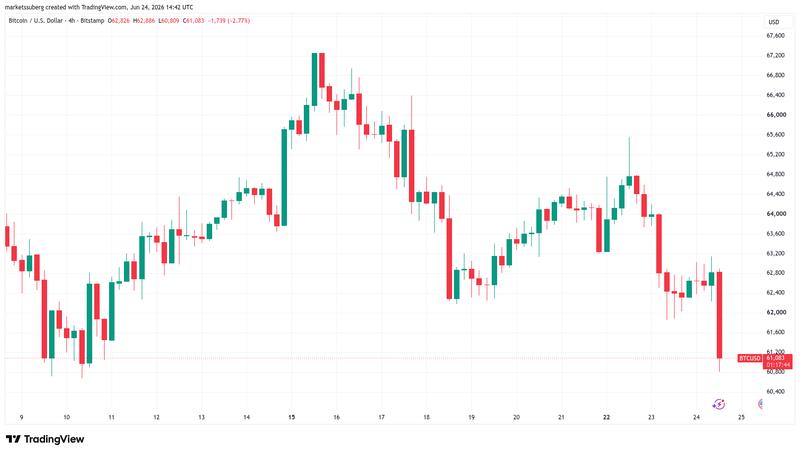
As Wall Street commenced trading on Wednesday, Bitcoin (BTC) reached fresh two-week low levels, while market participants forecasted an upcoming rally toward a "poor" lower high.
Key points:
- The Bitcoin price trajectory moves closer to the lower bounds of its trading range, which market participants continue to view as stable support.
- Market analysts suggest a relief rally should materialize in the near term, with price objectives approaching $70,000.
- Developments in US-Iran peace negotiations have yielded minimal positive influence on risk assets, as US equities remained relatively unchanged at market open.
BTC price nears range lows: Is $70,000 next?
Information from TradingView revealed BTC price movement falling beneath the $60,000 threshold for the first occurrence since June 10.
Market participants had cautioned about escalating short interest accompanied by rising funding rates, increasing the likelihood of a capitulatory downward movement.
"It's time to start bouncing soon on the LTF," trader Killa wrote in ongoing commentary on X, referring to low time frames.
"Range bound till proven otherwise."
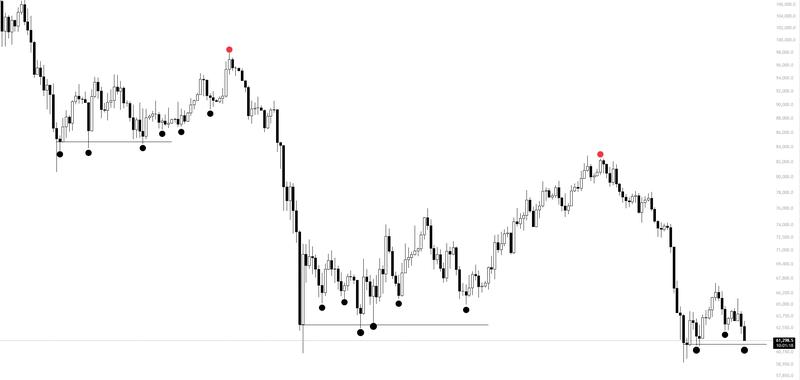
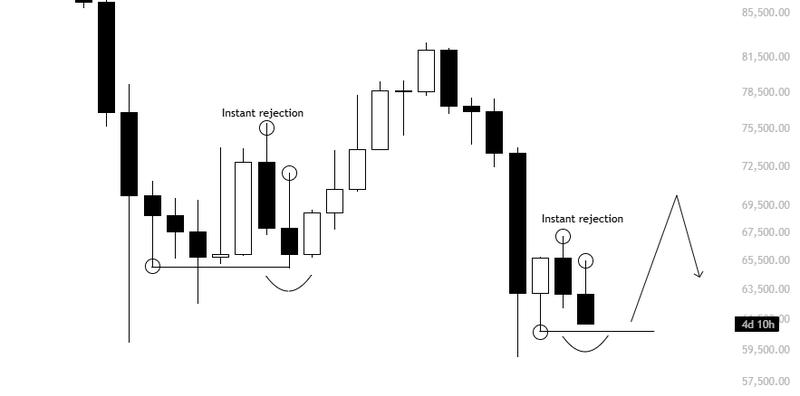
Killa shared an additional chart illustrating a relief bounce toward $70,000, being due following the bounce.
Trader RektProof maintained a largely comparable outlook, anticipating BTC/USD would continue trading within a defined range with $60,000 serving as the support level "for the rest of the month."
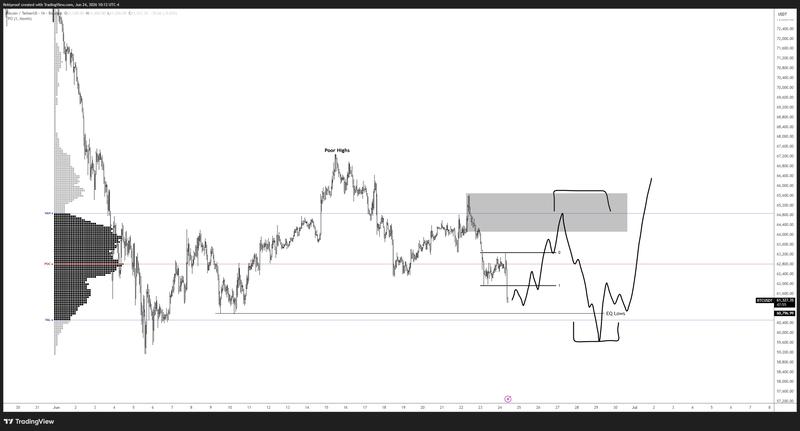
"Overall, a move to supply and back down to the EQ lows before forming back to poor highs + 70k," he added.
Stocks tread water as Hormuz oil transit progresses
From a macroeconomic perspective, US equity markets seemed to have already factored in the positive developments from the US-Iran peace deal.
Gains remained constrained at the opening bell despite US President Donald Trump providing additional specifics regarding mutual cooperation between the two sides.
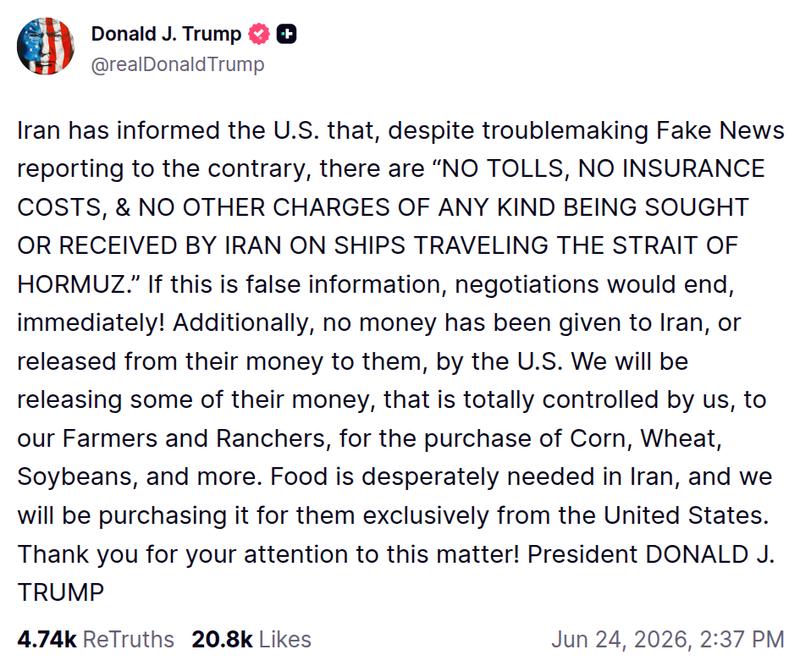
Trump specifically made reference to the Strait of Hormuz oil transit route, writing in a post on Truth Social that there would be "no tolls, no insurance costs, & no other charges of any kind being sought or received by Iran on ships traveling" via the route.
The S&P 500 traded up 0.4% at the time of writing, while the Nasdaq Composite Index even turned slightly negative on the day.
Earlier, Cointelegraph reported on several factors keeping risk-asset enthusiasm in check, including forward earnings guidance by tech giant Micron Technologies and the May print of the Personal Consumption Expenditures (PCE) index, due out on Wednesday and Thursday, respectively.