BTC Bulls Target $80K: Three Technical Indicators Point to March Rally
Technical analysis reveals a potential Bitcoin rally to $80,000 in March, supported by a symmetrical triangle pattern breakthrough and an outstanding CME futures gap.

Bulls controlling Bitcoin (BTC) are setting their sights on a potential rally back to the $80,000 level during March, as no fewer than three technical indicators are signaling strengthening upward momentum.
Key takeaways:
- Bitcoin registered a surge exceeding 5% on Wednesday, climbing toward the $72,000 mark.
- Several technical indicators, most notably a symmetrical triangle formation, are pointing toward a sustained price advance reaching $80,000.
Bitcoin negates bearish continuation pattern
During Wednesday's trading session, the price action of BTC demonstrated signals that it was invalidating what had previously looked like a bearish pennant formation.
The BTC/USD trading pair successfully broke through the pennant's resistance trend line following a 5.21% surge that pushed prices to approximately $71,900. The breakout was accompanied by elevated trading volume, suggesting heightened conviction among market participants supporting the upward movement.
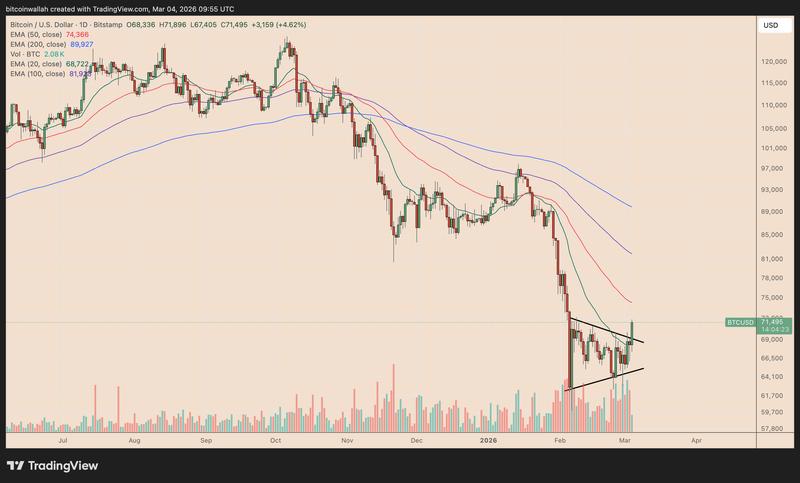
This development concurrently elevated the probability of a bullish reversal stemming from a symmetrical-triangle pattern.
The formation of a symmetrical triangle occurs when an asset creates a series of descending highs coupled with ascending lows, resulting in price compression within an increasingly narrow range.
The pattern reaches resolution once the price breaches one of the converging trendlines and typically travels a distance equivalent to the pattern's maximum vertical height.
For BTC specifically, the triangle's broadest point spans approximately from $63,000 to the $71,000–$72,000 zone.
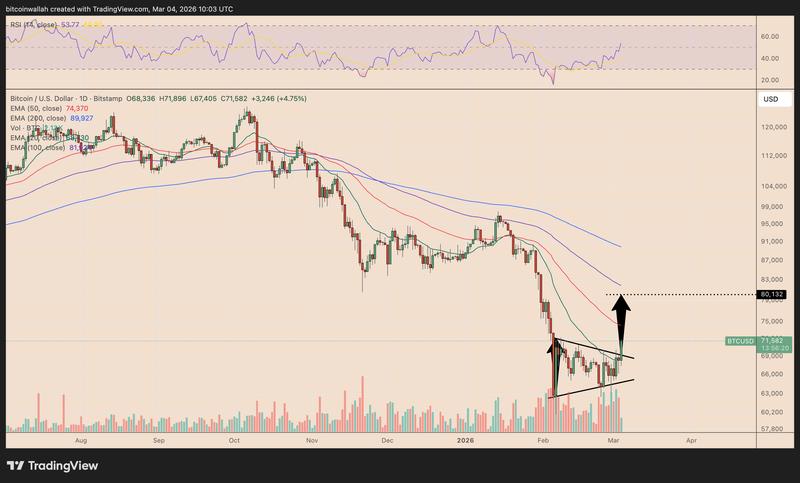
A textbook measured projection beyond the upper boundary suggests a target near $80,000 in March assuming the breakout maintains its integrity. This price level corresponds with BTC's 100-day exponential moving average (100-day EMA, shown as the purple line).
The immediate resistance for BTC appears at the 50-day EMA (depicted in red) situated near $74,400. A price rejection at this level would compromise the breakout's validity and increase the likelihood of a retracement toward the 20-day EMA (shown in green) hovering around $68,700.
BTC futures gap continues unfilled near $80,000
The triangle pattern's projected $80,000 target additionally coincides with an outstanding CME futures gap, establishing this zone as an obvious attraction point for bullish traders.
A CME gap develops because CME Bitcoin futures markets cease trading during weekend hours. When Bitcoin's spot price experiences movement while the futures market remains closed, the futures contracts can resume trading at a different price level, creating a vacant price zone visible on the chart.
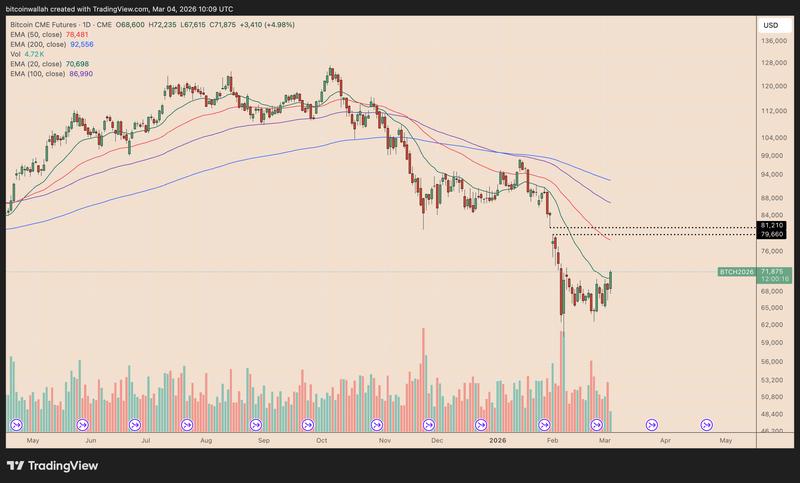
As of Wednesday's trading, this gap has remained open around the $79,660–$81,210 range since early February.
Historical data shows that nine out of the previous 10 CME gaps have eventually been filled beginning from August 2025, providing traders with justification to consider the $79,660–$81,210 zone as a high-probability target as spot and futures pricing converge.
Polymarket increases probability of $80,000 Bitcoin in March
Polymarket, a cryptocurrency-based prediction marketplace where participants trade contracts based on real-world event outcomes, is displaying an unmistakable bullish sentiment shift regarding BTC during March.
Market participants now attribute 40% probability that Bitcoin will reach $80,000 on Wednesday, representing a significant increase from 20% just one day earlier. The $75,000 price target commands even greater confidence at 70%, rising from 40% the previous day.
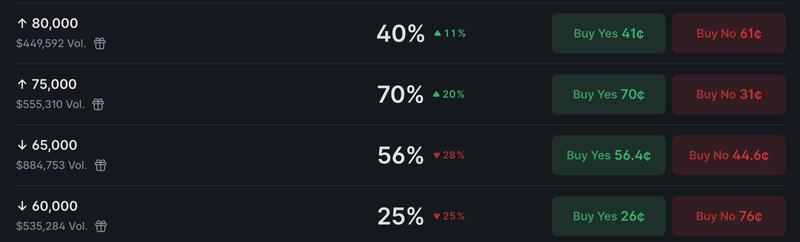
Simultaneously, the probability assigned to BTC price declining to $65,000 and $60,000 during March has been marked lower compared to previous assessments, indicating that market participants are reducing their expectations for downside price movement.