BTC approaches $65K milestone as Trump announces Hormuz reopening in imminent Iran agreement
BTC maintained its position close to recent peaks following Trump's announcement of a US-Iran peace agreement, with technical indicators suggesting favorable conditions for a sustained price recovery.
Bitcoin (BTC) hovered around the $64,000 mark heading into the weekly close on Sunday as prospects of a US-Iran peace agreement gained momentum.
Key points:
- BTC maintains elevated levels as President Donald Trump announces Sunday signing of Iran peace agreement.
- Trump declares the Strait of Hormuz, a critical global oil transportation corridor, will become "open to all."
- Technical analysis indicates absence of bearish chart formations while open interest data points toward a sustainable price recovery.
Iran peace deal keeps Bitcoin rebound afloat
Information from TradingView revealed price movement stabilizing following regional peaks of $64,750 recorded on Bitstamp.
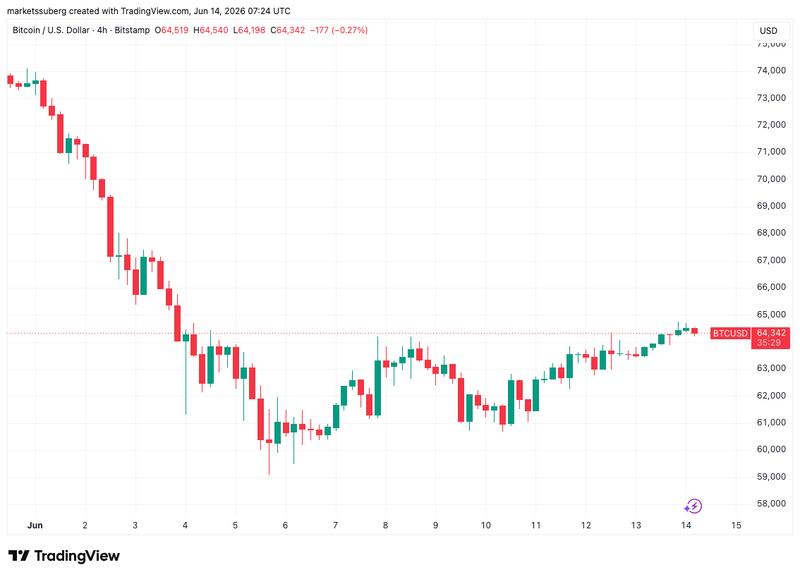
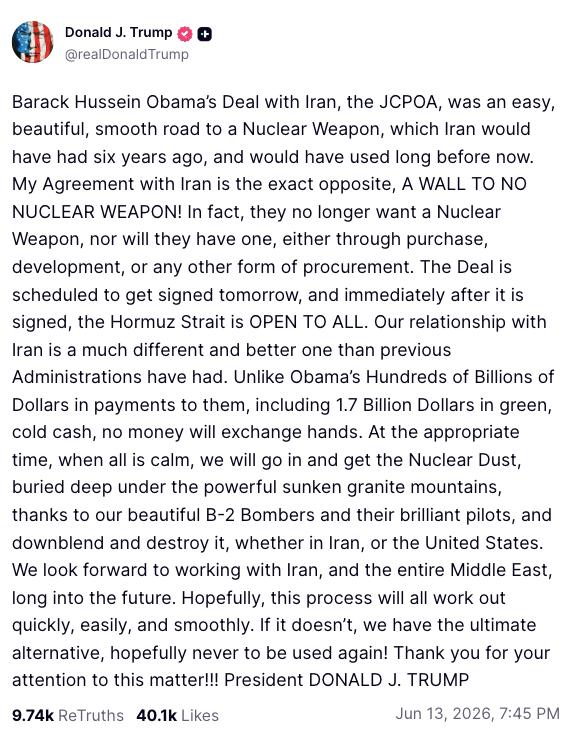
The price peaks coincided with President Donald Trump's declaration that a peace agreement was set for Sunday's signing.
"The Deal is scheduled to get signed tomorrow, and immediately after it is signed, the Hormuz Strait is OPEN TO ALL," he wrote in a post on Truth Social.
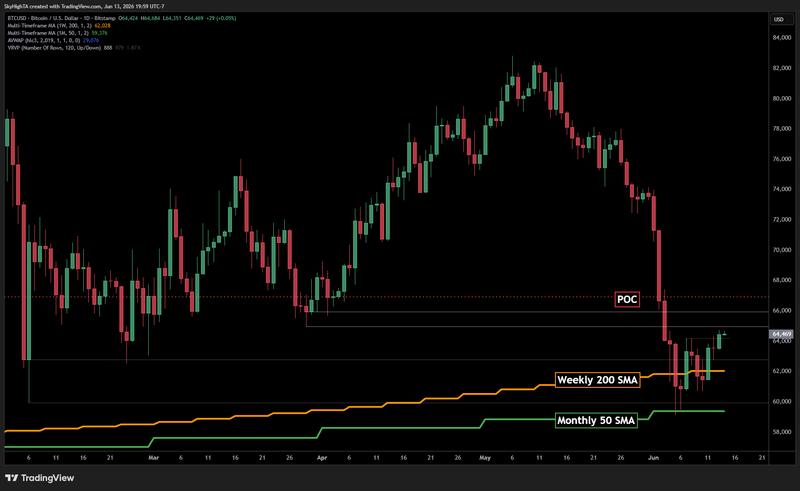
Within trading circles, renewed optimism emerged that selling pressure on Bitcoin was beginning to diminish. Trader SuperBro observed that the 200-week simple moving average (SMA) was maintaining its role as support.
"In a word, constructive," they summarized about low-time frame BTC price action in a post on X.
SuperBro rejected worries about a bearish breakdown formation being active, choosing instead to highlight a point of control (nPOC) level on exchange order books positioned above the current spot price.
"$65K-$67K is a big test, at the last swing low and volume POC. If we can rip through this zone then the bear case takes a massive hit," they concluded.
Cointelegraph previously reported on misgivings about the 200-week SMA, which history had shown to be "unreliable" as a bear-market safety net.
Key BTC price setup "finally happening"
Meanwhile, trading account Cryptic Trades highlighted a significant combination of increasing open interest alongside decreasing funding rates across exchanges.
"It's finally happening," it told X followers about what could support more sustainable BTC price strength.
Cryptic Trades indicated that present market conditions demonstrated a shortage of conviction among bullish traders, thereby eliminating the danger of fresh long positions becoming ensnared ahead of another potential decline.
"In other words, these aren't longs aggressively chasing the move. These are bears doubling down, increasing their short positions, and betting that the downtrend isn't over," it explained.
"This is exactly the kind of setup that generally marks durable bottoms. The market starts moving higher, sentiment remains overwhelmingly bearish, and the most keep leaning the bearish. This is how aggressive short squeezes are born."
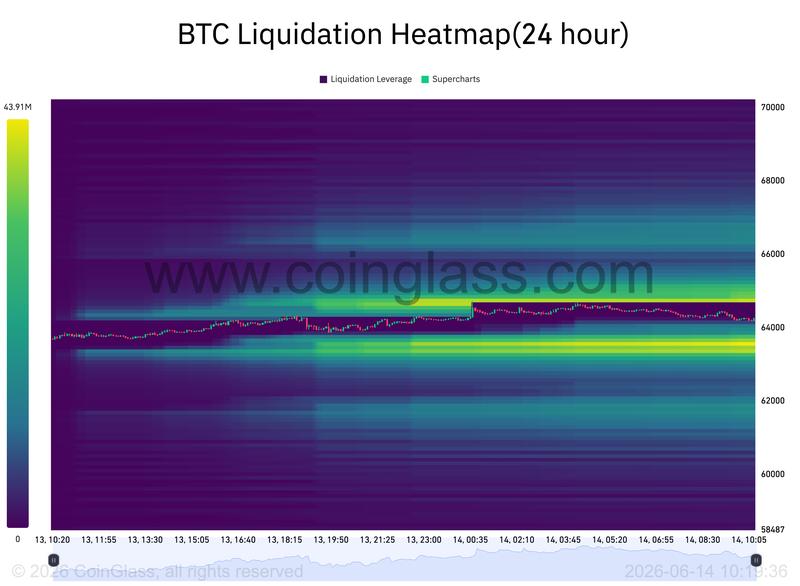
Information from CoinGlass demonstrated that the regional price peaks aligned with a substantial cluster of potential short liquidations.