BTC approaches $62K support zone as historical bear cycle patterns emerge again
BTC continues to shed critical support levels in a pattern reminiscent of previous bear cycles, with price action reaching fresh weekly lows.

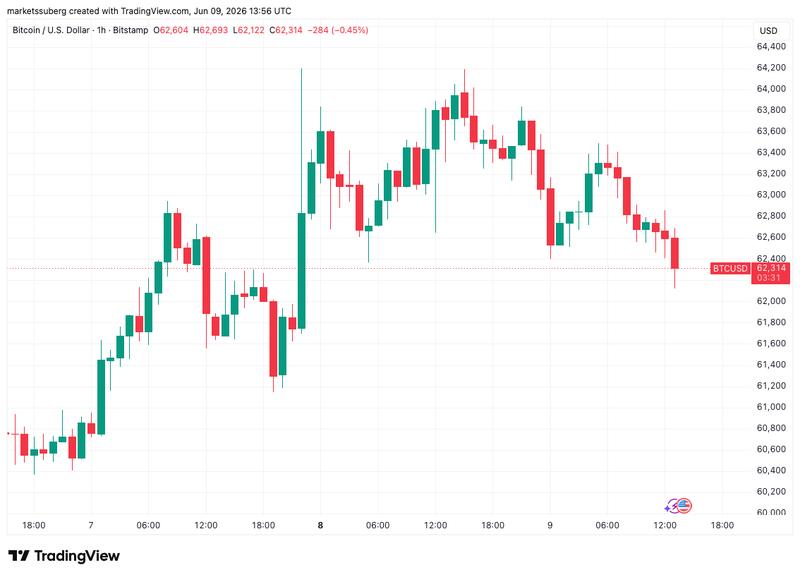
As Wall Street trading commenced on Tuesday, Bitcoin (BTC) descended to its lowest levels of the week, while technical analysis identified $65,000 as the critical threshold bulls must reclaim.
Key points:
- Fresh BTC price analysis indicates bulls require a return to $65,000 levels to regain control.
- Historical bear market patterns continue unfolding as BTC/USD surrenders crucial support zones.
- Optimism regarding Iran peace negotiations pushes oil beneath $88 mark for first time in June.
BTC price action mirrors historical bear cycles through support breakdown
According to TradingView data, BTC experienced a 1.2% decline throughout the trading session as selling pressure intensified in advance of crucial US inflation figures.
Following a double rejection at the $64,200 price point, BTC/USD appeared poised for another examination of the critical $60,000 support threshold.
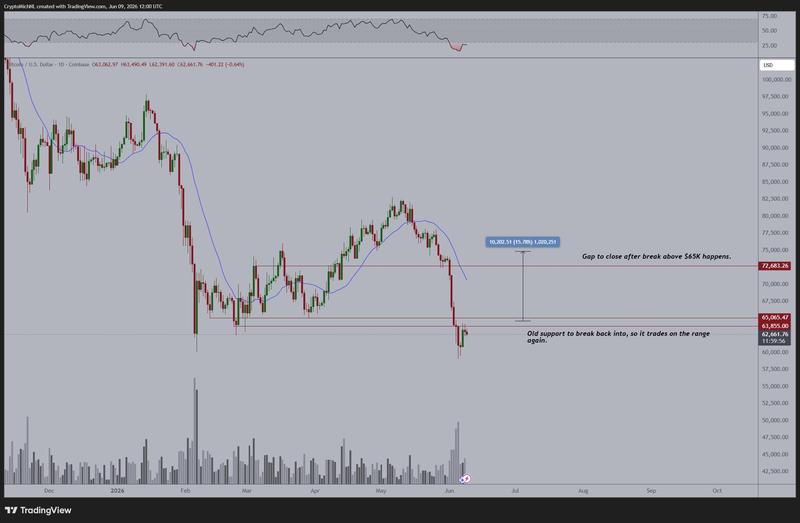
In his analysis, trader and analyst Michaël van de Poppe emphasized that bulls would need to successfully breach $65,000 to establish dominance in the market.
"Bitcoin is stalling beneath $65K as breaking that level would trigger a strong run to $72-74K," he wrote in one of his latest posts on X.
"The $65K support level was the previous level of support after the crash early in February and is now acting as the resistance to break through."
Van de Poppe expressed skepticism regarding whether Bitcoin's recent macro bottom at $59,100 from last week would hold as the ultimate low.
"I don't think it will take long before the markets will be doing this, as the recent selloff was relatively irrational," he added.
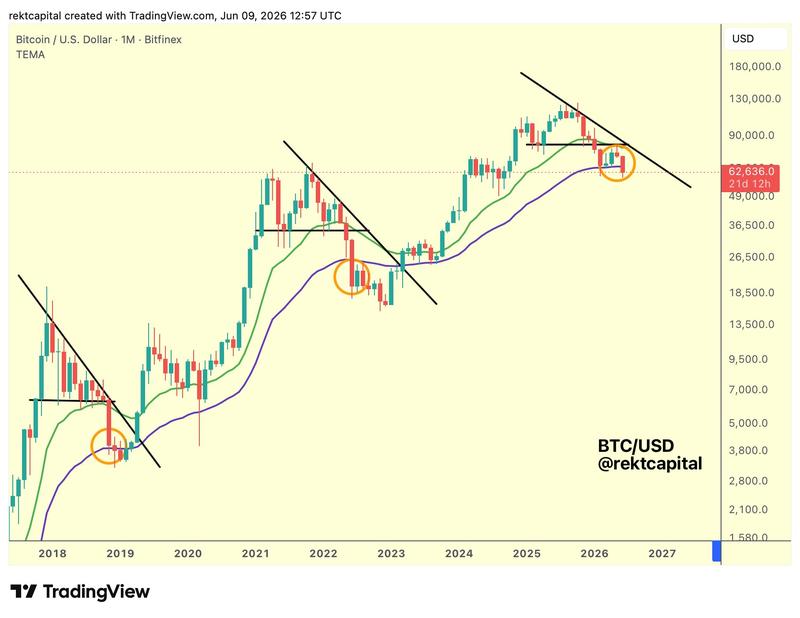
Providing an analysis of ongoing bear market dynamics, trader and analyst Rekt Capital identified two additional notable parallels between present-day BTC price movements and the trajectories observed during previous cycle bottoms.
He observed that BTC/USD had relinquished both its 50-month exponential moving average (EMA) as well as support from a triangle pattern construction — mirroring the behavior witnessed in 2018 and 2022.
"Now Bitcoin needs to fully confirm this breakdown to enter additional Bearish Acceleration to the downside," he told X followers.
Crude oil retreats to June lows amid emerging Iran peace prospects
During the trading session, Bitcoin exhibited divergent behavior from US equities markets, declining while the S&P 500 and Nasdaq Composite Index both posted opening gains approaching 1%.
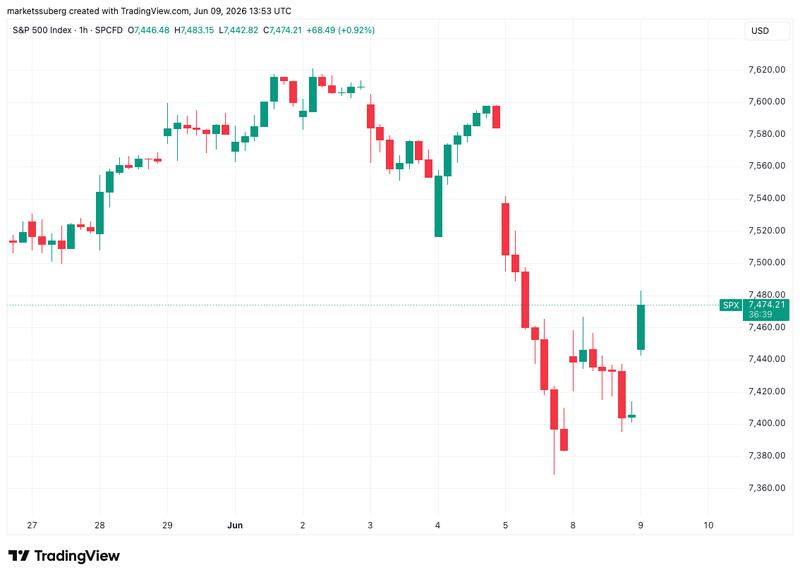
The positive equity performance helped offset Monday's opening declines that followed pressure on Asian markets stemming from a technology stock selloff.
Meanwhile, crude oil valuations declined as expectations for a potential peace agreement between the United States and Iran gradually gained momentum.
"It'll be a total victory," US President Donald Trump said in a telerally for Republican Senator Lindsey Graham on Monday, quoted by Al Jazeera and others. "It'll happen very soon, and oil prices will come tumbling down."
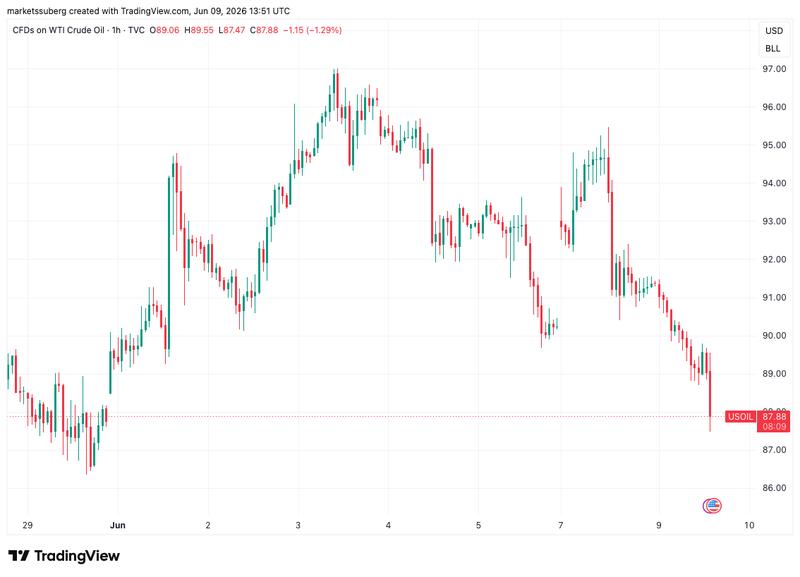
WTI crude dropped under $88 per barrel, reaching its lowest level since May 29.