BTC and ETH Stage Recovery Rally Amid Market Panic and Resurgent ETF Inflows
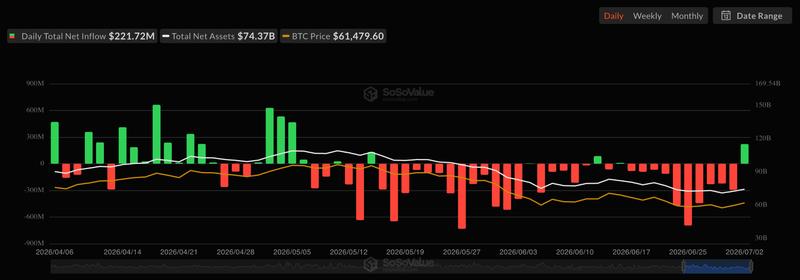
Following multi-year lows, Bitcoin and Ether experienced a rebound as bargain hunters entered the market, with spot Bitcoin ETFs recording $221 million in inflows on July 2.

On July 3, Bitcoin (BTC) experienced a surge, reaching just $50 below the $63,000 threshold, while Ether (ETH) demonstrated stronger performance than the broader cryptocurrency market, climbing to $1,775. This late-week recovery follows recent price action that saw BTC plummet to its lowest point in 21 months, with ETH declining to new year-to-date lows. The prevailing pessimistic market sentiment was clearly reflected in the Crypto Fear & Greed index, which showed "Extreme Fear" with a reading of 11 out of 100.
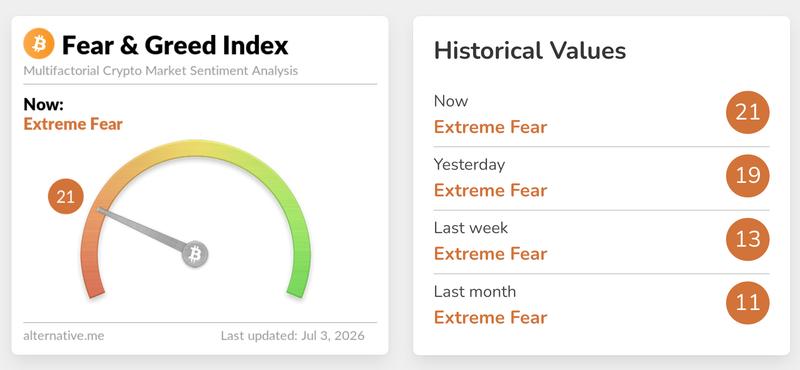
The disconnect between Friday's positive price movement and the "Extreme Fear" metric is particularly noteworthy. US spot Bitcoin exchange-traded funds (ETFs) recorded a net inflow of $221.7 million on July 2, marking the most substantial single-day capital influx since early May and ending a streak of 10 straight days characterized by outflows.
Futures markets fuel Bitcoin and Ether gains
When examining the leveraged segment of the cryptocurrency market, conditions appear more skewed than what spot purchasing data would indicate on its own. "Funding," which represents the regular payment made by traders maintaining long positions to those holding short positions when market sentiment tilts bullish, has remained in positive territory for eight consecutive days and has shown an upward trajectory during this timeframe.
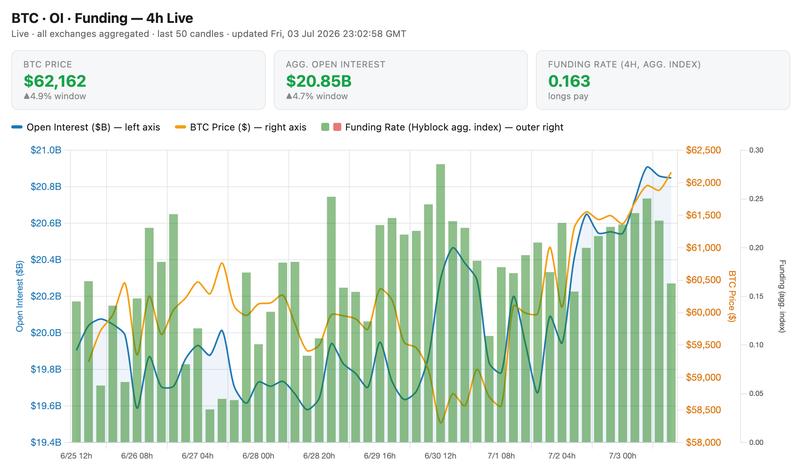
The aggregate value of open leveraged Bitcoin contracts currently sits near its peak level across recent days, despite price action remaining largely range-bound. When leverage accumulates while price fails to demonstrate significant upward movement, this is typically interpreted as a warning signal rather than validation of a sustainable uptrend.
Can bulls keep their pace?
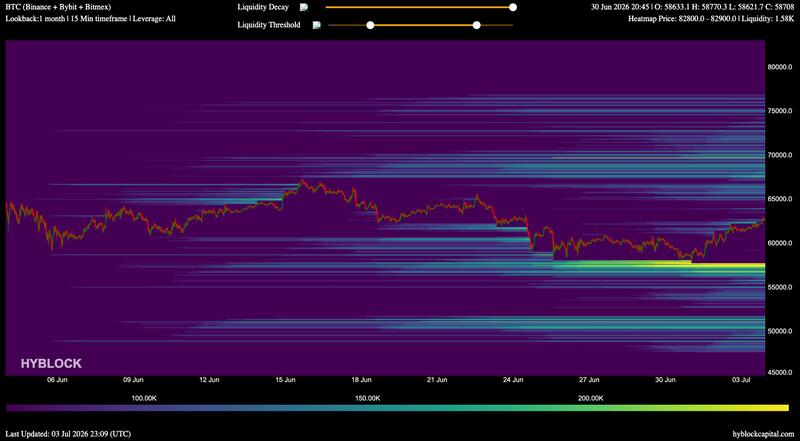
Examining the upcoming trading sessions reveals several critical markers worth monitoring. From a risk perspective, Bitcoin's ability to maintain support above approximately $61,000, an area characterized by a significant concentration of leveraged long positions, is crucial. Equally important is determining whether the ETF inflow witnessed on Wednesday represents an isolated occurrence or signals the beginning of a sustained trend shift.
From an optimistic perspective, a recovery above $62,500 would position Bitcoin within striking distance of price zones where leveraged short positions face increased vulnerability. Additionally, sustained positive buying momentum combined with a continuously expanding pool of leveraged contracts would represent a continuation of the trend observed throughout recent days.
The current market landscape presents a complex picture that defies straightforward bullish or bearish categorization. While spot purchasing activity and a resurgence in ETF capital flows indicate that investor sentiment might be recovering more rapidly than the fear-and-greed indicator suggests, a market exhibiting such profound fear while simultaneously carrying heavy leverage tilted toward upside bets typically demonstrates heightened fragility. The approaching US holiday weekend, which traditionally brings reduced trading volumes, introduces an additional element of unpredictability to the present market configuration.