Bitcoin's Outlook if US Treasury Yields Breach the 5% Threshold
Historical oil-related conflict shocks increased inflation and diminished risk-on sentiment, suggesting Bitcoin could drop beneath $50,000 by 2026.

While Bitcoin (BTC) has demonstrated strong performance relative to other assets during the ongoing US–Iran conflict, indicators suggest the cryptocurrency's upward momentum may be reaching its limits as the bond market shows signs of becoming "out-of-control."
Key takeaways:
- The potential exists for US benchmark yields to increase by 200 basis points should the US–Iran conflict continue to escalate.
- Historical conflicts tied to oil market disruptions have increased inflation while dampening investor appetite for risk, suggesting BTC's price could fall beneath $50,000 during 2026.
Potential oil shock could push US yields beyond 5%
Following the February 28 attacks on Iran by the US and Israel, the 10-year Treasury benchmark yield has surged to approximately 4.42%, marking its highest level in a nine-month period.
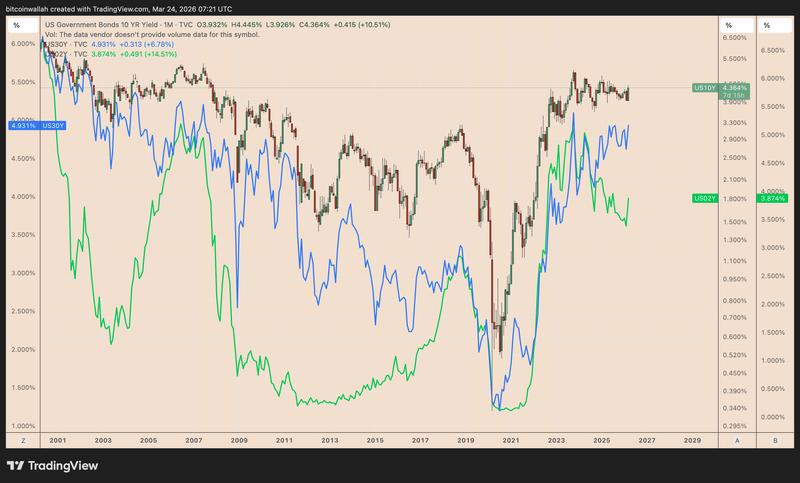
Meanwhile, the 30-year yield has climbed to approximately 4.97%, and the 2-year yield has advanced into the 3.95%–3.98% range.
The upward trajectory in Treasury yields reflects investor concerns that oil price increases driven by the conflict will elevate inflationary pressures, thereby reducing the likelihood of any interest rate reductions throughout 2026.
While President Donald Trump's five-day suspension of operations has temporarily alleviated concerns about potential strikes targeting Iran's energy infrastructure, the conflict is far from resolution given Iran's rejection of diplomatic talks and the continuation of cross-border hostilities as of Tuesday.
This situation is generating concerns among market observers about additional increases in US bond yields, with technical analysts projecting the 10-year yield could climb to 6.4%–representing a 200 basis point surge–should it successfully break above its symmetrical triangle formation.
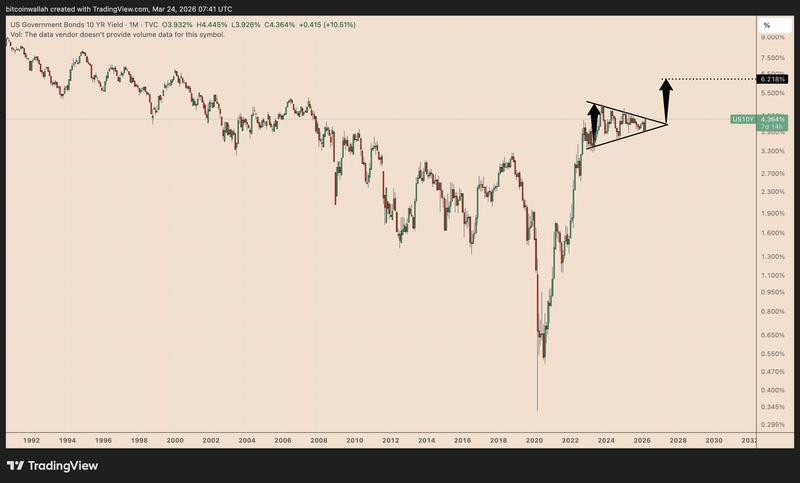
Rising yields make risk assets such as equities and Bitcoin less attractive by increasing the opportunity cost associated with holding them. Should the US 10-year yield surge past 5%, the BTC market could experience significant selling pressure if it maintains its correlation with traditional risk assets.
Historical oil shock precedents
Historical data reveals that brief oil-related conflicts have produced sharp yet temporary movements in yields and equity markets, whereas extended supply disruptions have driven yields higher while maintaining sustained pressure on stock prices.
The 1973 Yom Kippur War combined with the Arab oil embargo initially produced modest yield increases before accelerating as inflationary forces intensified, with the S&P 500 experiencing declines ranging from 41%–48% throughout the "stagflation" period.
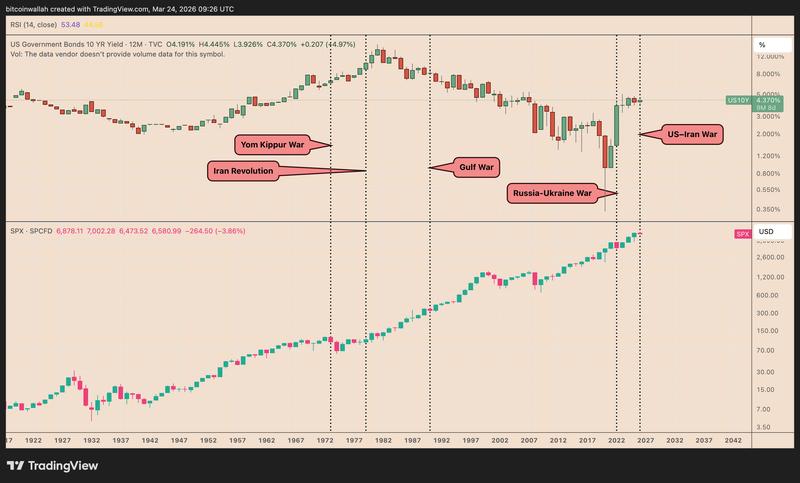
The 1979 Iranian Revolution triggered a more pronounced response in bond markets, with the 10-year yield increasing approximately 150–200 basis points throughout the subsequent year, though equity markets experienced relatively smaller pullbacks.
During the 1990–91 Gulf War, the 10-year yield increased approximately 50–70 basis points while the S&P 500 declined roughly 16%–20% before recovering following the conflict's containment.
The 2022 Russia–Ukraine war similarly coincided with elevated yields and an initial 5%–10% decline in the S&P 500.
The ongoing conflict between the US and Israel versus Iran seems to be following the early-stage characteristics of this historical pattern. Should the conflict persist and oil prices remain elevated, yields may continue climbing while risk assets could face additional downward pressure.
Given Bitcoin's strong correlation with the S&P 500, this scenario would likely result in increased downside pressure on the cryptocurrency unless rapid de-escalation of the conflict occurs.
Potential Bitcoin price floor scenarios
From a technical analysis standpoint, Bitcoin's price could decline toward $50,000 or potentially lower over the upcoming months should it break down from its current bear flag pattern formation.
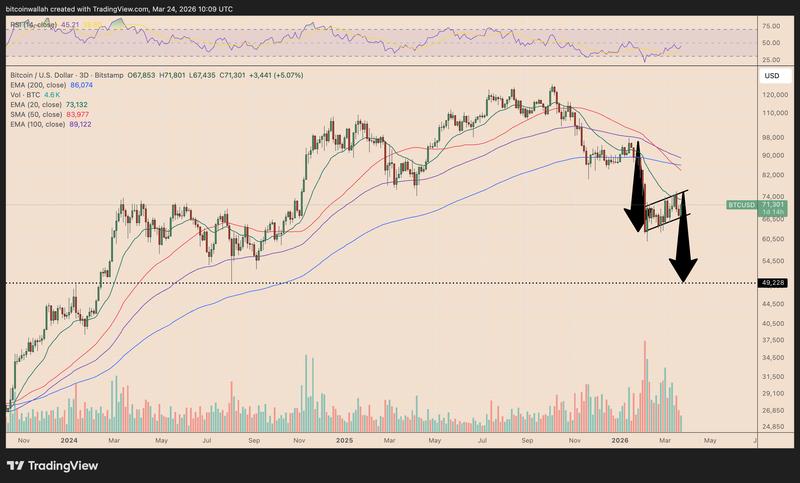
Such projections are generally consistent with current prediction market positions, where traders are assigning a 70% probability to Bitcoin falling beneath $55,000 during 2026 and a 46% probability of declining below $45,000.
Arthur Hayes, co-founder of BitMEX, has suggested that a prolonged US–Iran conflict could compel the Federal Reserve to adopt looser monetary policy measures, which would create bullish conditions for Bitcoin.
"The longer this conflict goes on, the higher the likelihood that the Fed has to print money to support the American war machine," he said, adding:
"That's when I'm going to buy Bitcoin when the central banks start printing money."