Bitcoin Recaptures Critical 21-Week Trendline for First Time Since October 2025: Key Market Insights This Week
The final week of April kicks off with Bitcoin securing a crucial weekly close beyond resistance levels while market liquidity dynamics fuel price movements.

As April draws to a close, Bitcoin (BTC) launches another attempt at the $80,000 level while price action hints at crucial breakout patterns.
- For the first time since October 2025, Bitcoin completes a weekly close above a critical trend line.
- Market participants focus on liquidity dynamics as potential support retests near $70,000 come into view.
- Upcoming Federal Reserve rate decision and inflation figures represent significant macro volatility triggers.
- Market analysis points to capitulation phase ending as institutional players stabilize Bitcoin markets.
- Manufacturing data from the US may help BTC/USD steer clear of retesting its macro lows.
Bitcoin achieves first weekly close above 21-week trendline in half a year
Despite falling short of reaching $80,000 and failing to sustain its recent rally, the weekly candle close remained meaningful for Bitcoin.
Following a late surge upward, BTC/USD succeeded in closing the weekly candle marginally above a critical trend line, according to data from TradingView.
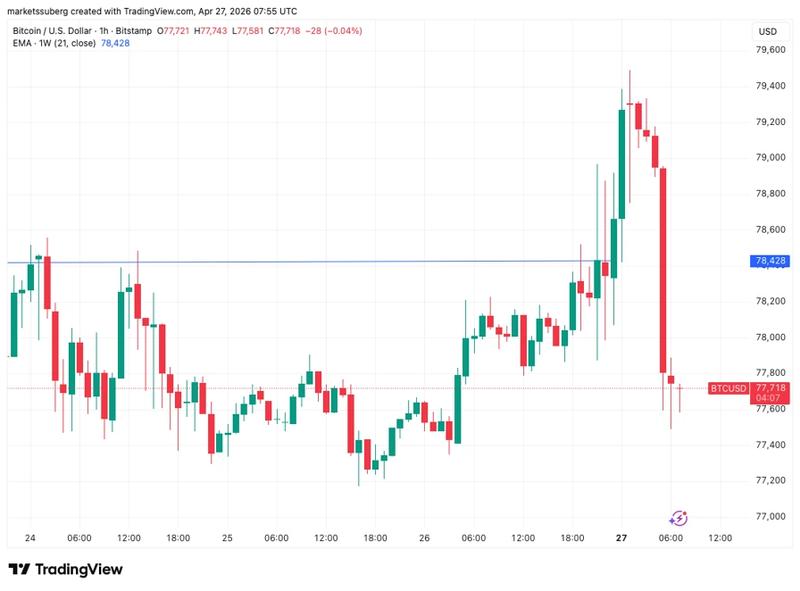
The trend line in question represents its 21-week exponential moving average (EMA) — functioning as a resistance element on the chart continuously since October 2025. The previous weekly close beyond this level occurred when the trading pair was positioned near $115,000.
According to Cointelegraph's previous coverage, trader and analyst Rekt Capital had been monitoring the 21-week EMA closely.
A weekly close surpassing this level, he suggested the previous week, represented a necessary condition for preventing a support retest around $73,000.
"Unless BTC is able to reclaim the 21-week EMA as support... Then this EMA could indeed force BTC into a post-breakout retest of the top of the Double Bottom price broke out from last week," he communicated to his X followers.

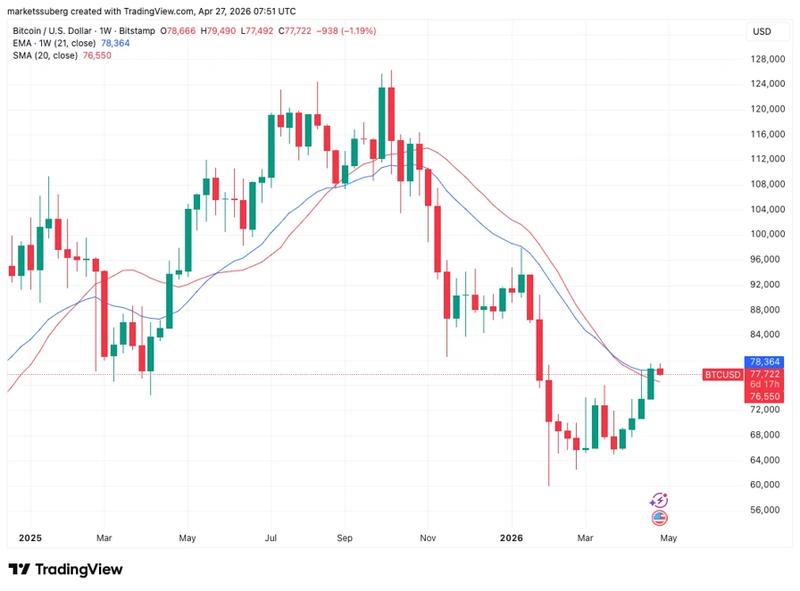
The 21-week EMA presently establishes the upper limit of Bitcoin's bull market support band, working in tandem with the 20-week simple moving average (SMA) positioned at $76,550.
In a similar fashion, October of the previous year marked when price action delivered a weekly close completely above both trend lines of the support band.
During the previous week, trader Daan Crypto Trades indicated that such an occurrence "could confirm the end of this down trend and further relief bounce."
Short-term BTC price movements shaped by liquidity dynamics
Across lower time frames, the Bitcoin price environment presents traders with contradictory indicators.
While overall momentum remains intact notwithstanding geopolitical tensions, bullish market participants face challenges in recapturing important support thresholds.
"Some great momentum on $BTC lately, however there are some crucial levels to consider," crypto trader Michaël van de Poppe noted in his most recent analysis shared on X.
According to van de Poppe, price action successfully pushing through $79,000 clears the route toward levels reaching $100,000, though this advancement will "take time."
"If there's no clear breakout at $79K, it wouldn't be surprising to expect some period of consolidation before there's another test of the resistance," he explained.
"In that case, there's a level that I prefer to see hold: $73.5k+."
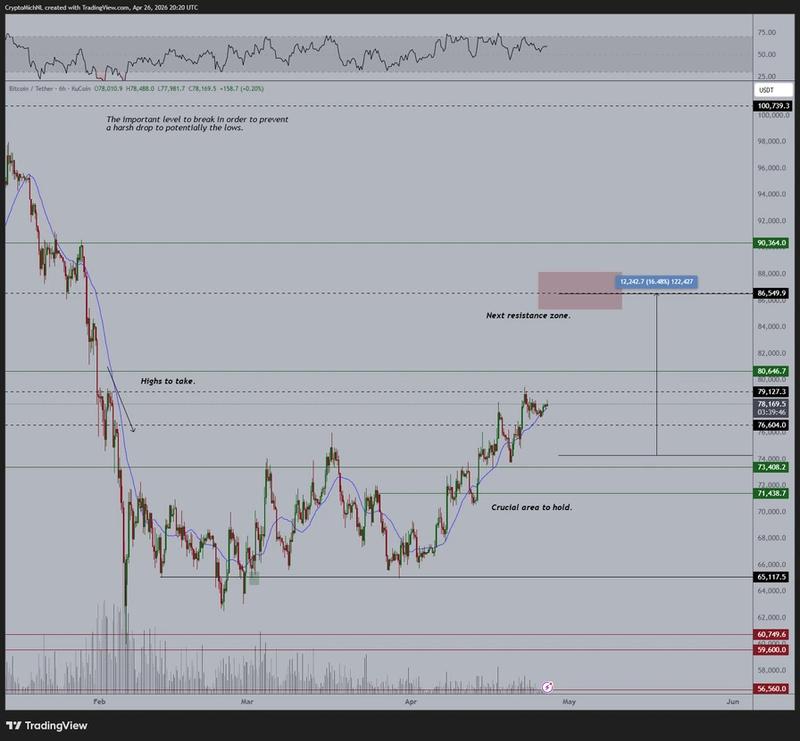
Previously, Cointelegraph documented market expectations regarding a potential BTC price pullback and potentially even fresh macro lows.
Van de Poppe further noted that such a scenario might materialize should the $73,000 zone prove unable to hold.
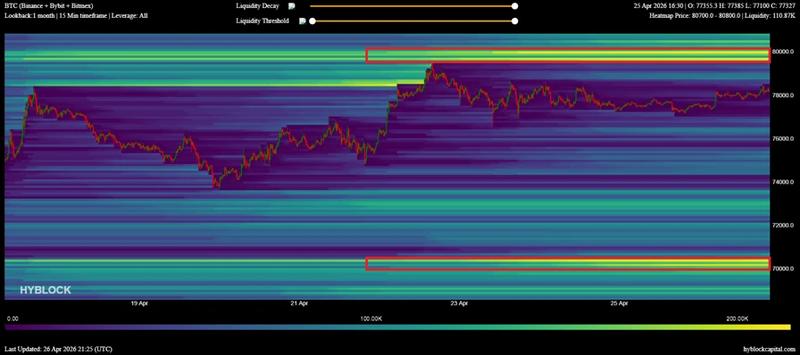
Expanding on this theme, trader CrypNuevo proposed that liquidity capture events could trigger that journey toward the bottom end of the $70,000-$80,000 range.
Following the weekly candle close, BTC/USD eliminated late short positions positioned above $79,000 before swiftly reversing direction, liquidating recently established long positions, according to data from CoinGlass.
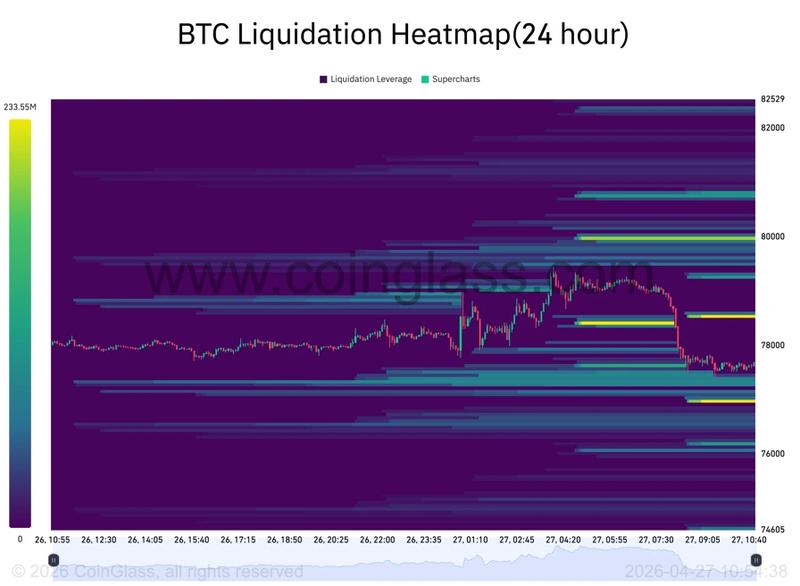
"Price could take the upside liquidations first in a range highs deviation, before going for the lower ones at $70k mid-range," CrypNuevo forecasted.
He further observed that both the $70,000 and $80,000 levels featured an "interesting amount" of potential liquidations available for capture.
Jerome Powell's concluding Fed FOMC meeting carries equity market implications
Despite ongoing uncertainty surrounding the US-Iran war roadmap, risk appetite appears to be "returning," according to market analysis.
The current week opened with optimism regarding additional negotiations aimed at conflict resolution, this time stemming from a proposal originating from Iran.
Bitcoin seemed to derive encouragement from this development, recording fresh multimonth peaks before rapidly pulling back.
"Risk appetite continues to grow rapidly in this market," trading resource The Kobeissi Letter posted in an X response as BTC/USD approached $79,500.
Macro-level volatility is anticipated to persist throughout the upcoming days, driven additionally by US macroeconomic calendar events.
The Federal Reserve's subsequent decision regarding interest-rate adjustments arrives on Wednesday, with market observers closely monitoring Chair Jerome Powell's press conference for guidance concerning future monetary policy direction.
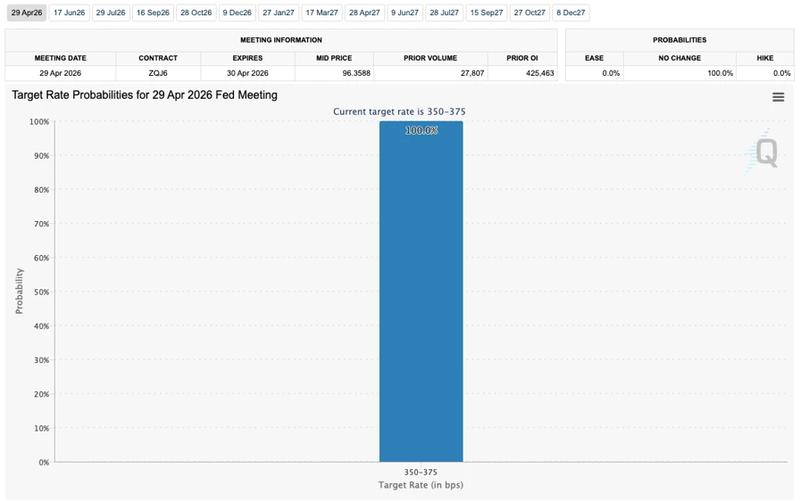
The ongoing conflict has introduced additional inflation uncertainties for the United States, and Thursday's publication of the Fed's "preferred" inflation indicator should demonstrate its influence on the inflation trajectory.
The current week additionally represents the final Federal Open Market Committee (FOMC) meeting with Powell serving as Chair, preceding the anticipated transition to Kevin Warsh.
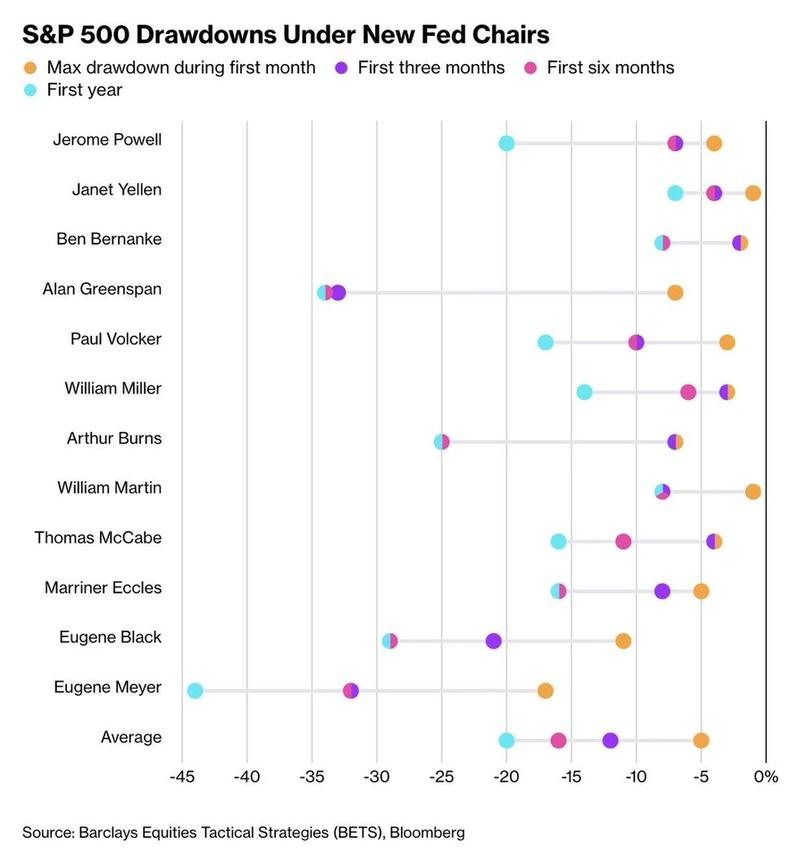
"New Fed chairs have a history of being greeted with market volatility," trading resource Mosaic Asset Company observed in the most recent installment of its regular analysis series, The Market Mosaic.
An accompanying visualization illustrated the average S&P 500 drawdown during the year a new Fed chair assumes control at 20%.
Market analysis identifies "structural bottom" established for BTC price
Bitcoin's proximity to $80,000 has prompted analysts to declare that the "end of capitulation" has already materialized.
Within one of its QuickTake blog entries published on Monday, onchain analytics platform CryptoQuant highlighted institutional investors as the primary stabilizing force throughout the 2026 bear market.
"During the Hormuz Shock, large investors refused to sell their Bitcoins and the panic in derivatives was irrelevant, as institutional conviction was already cemented," contributor GugaOnChain stated.
During early February, CryptoQuant contended, when BTC/USD temporarily declined to approximately $60,000, a "purge" of investors lacking strong conviction had been in progress for multiple months.
"Operators took profits, purging weak hands and retreating the support to $54.5K," GugaOnChain elaborated, referencing Bitcoin investors' average cost basis, alternatively referred to as realized price.
"In practice: the retail that paid the speculative premium at $90K entered absolute panic with the free fall. Forced to sell at a loss, they returned their Bitcoins to the Smart Money in the $62K zone, establishing an early support above the fair price."
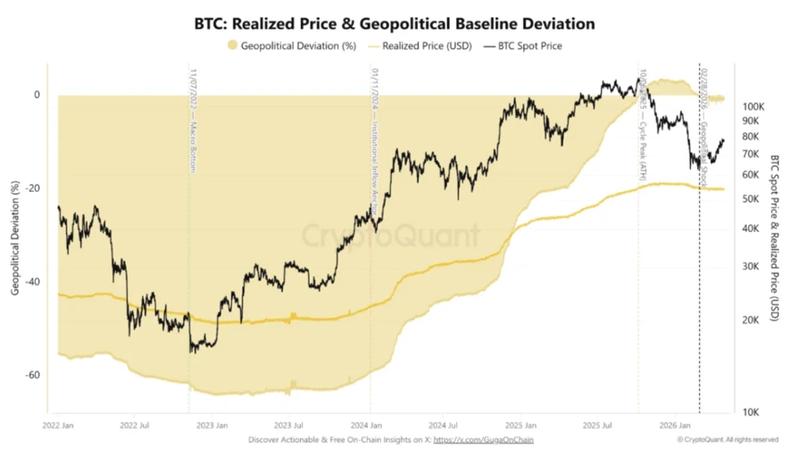
CryptoQuant characterized the "apex" of this process as taking place during February, with a recovery phase active since that time.
"The apex of this purge occurred on February 5, 2026, consolidating the ground zero of this Bear Market. With the Spot squeezed at $62.8K and the Realized Price (RP) at $55.3K, the deviation was only 1.34%," GugaOnChain detailed, identifying a "structural bottom."
Manufacturing data from US could prevent Bitcoin from reaching fresh bear-market lows
During the present period of macro volatility, the US Purchasing Managers' Index (PMI) has represented a crucial upside trigger for cryptocurrency and risk assets.
This pattern appears set to continue, with PMI transitioning into an "expansion" phase for the first time since 2022.
According to commentator Matthew Hyland, this development now carries implications for Bitcoin price behavior throughout the remainder of 2026. Within this bear-market year, BTC/USD should establish a bottom during Q4, mirroring 2022 — however PMI should transform the landscape.
"Because of the strength of the PMI expansion trigger along with the other 10+ signals I do not believe the '4 year cycle' works out as most expect," he posted on X.
Rather than surpassing its February lows, Bitcoin should instead establish a "higher low" near $60,000, contradicting prevailing market expectations. In support of this thesis, Hyland referenced "10+ signals" indicating that the new bottom has already been established.
"My invalidation would be a severe black swan something worse than the past few months however black swans are NOT likely so Its low percentage odds of being invalidated and not favorable to happen," he concluded.