Bitcoin Eyes $69K Recovery as Crude Oil Tumbles: Weekly Market Outlook
BTC traders anticipate price movement toward $69,000 in the coming days as the Iran-US peace agreement provides market momentum and crude oil falls beneath the $80 threshold.

Bitcoin (BTC) enters June's third week demonstrating positive momentum following the Iran-US peace agreement that has lifted risk-on assets across markets.
Key points:
- BTC price movement aims for $66,000 while US equity futures rally and crude oil reaches its lowest point since the beginning of March.
- Market participants identify $69,000 as a probable near-term price objective for BTC.
- The Federal Reserve's upcoming interest-rate announcement faces intense scrutiny under newly appointed chair Kevin Warsh.
- Large Bitcoin holders have shifted away from distribution behavior, establishing a "rock-solid floor" in the vicinity of $60,000.
- Weak overall demand metrics cast doubt on the sustainability of bullish market conditions.
Crude oil slides beneath $80 amid Iran peace agreement timeline
Market attention this week centers on the Iran-US conflict as diplomatic resolution appears increasingly imminent.
Weekend updates first indicated a Sunday time frame for finalizing a ceasefire agreement, though this deadline was later extended to June 19.
Various sources subsequently verified that Iran and the United States would formalize an arrangement for a 60-day cessation of hostilities, alongside several additional provisions, at a Switzerland ceremony scheduled for Friday.
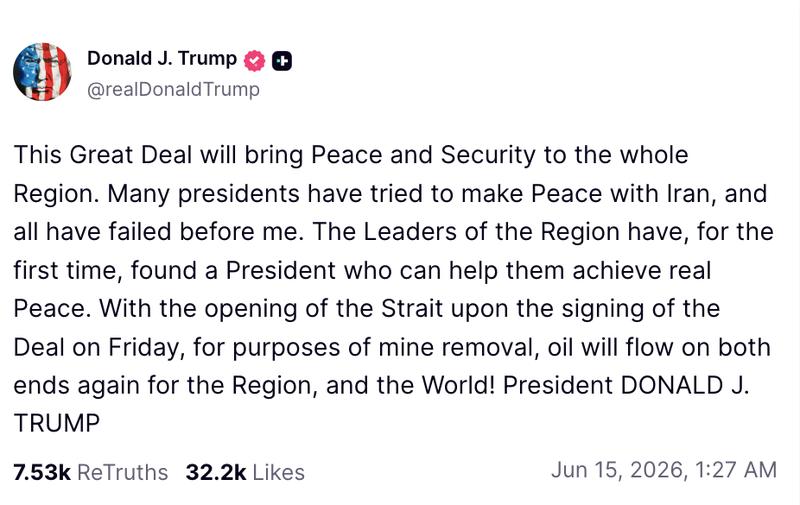
Through a Truth Social statement, US President Donald Trump validated that the arrangement would encompass the resumption of operations through the Strait of Hormuz — a critical international petroleum transportation route.
"With the opening of the Strait upon the signing of the Deal on Friday, for purposes of mine removal, oil will flow on both ends again for the Region, and the World!" he wrote.
US equity futures experienced substantial gains following this development, with risk-oriented assets climbing broadly — encompassing Bitcoin and cryptocurrency markets.
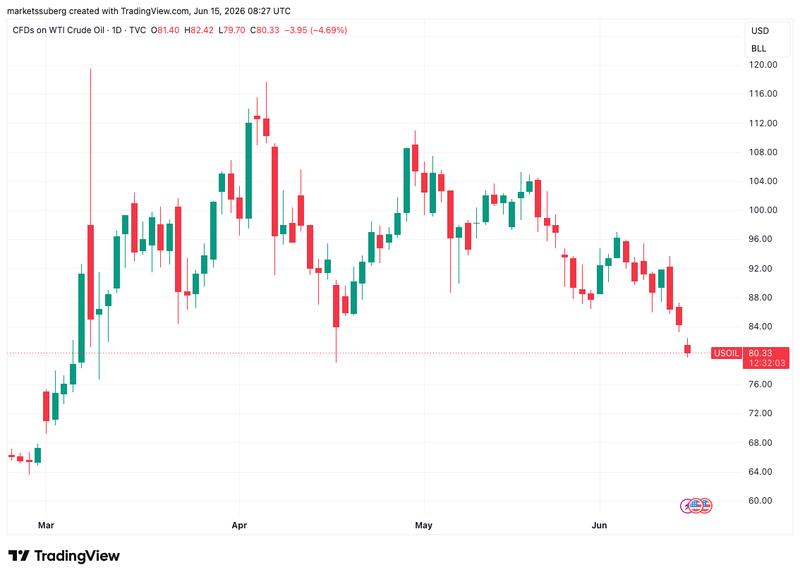
Crude oil, conversely, declined sharply, with WTI crude falling to trade beneath $80 per barrel for the first occasion since the middle of April.
In response, portfolio manager Danny Dayan characterized the agreement as the "biggest and worst TACO of all time," referencing the Trump administration's methodology toward multiple geopolitical and macroeconomic challenges.
"Overheat, higher core inflation, and higher neutral rate, will be the macro considerations ahead," he told X followers, seeing a pivot away from oil as a market mover.
During the entire conflict period, elevated oil prices have represented a constraining factor for Bitcoin, despite equities reaching successive new all-time peaks.
BTC/USD has now returned to precisely the same valuation it held when hostilities commenced on Feb. 28.
Market participants anticipate $69,000 short position liquidation
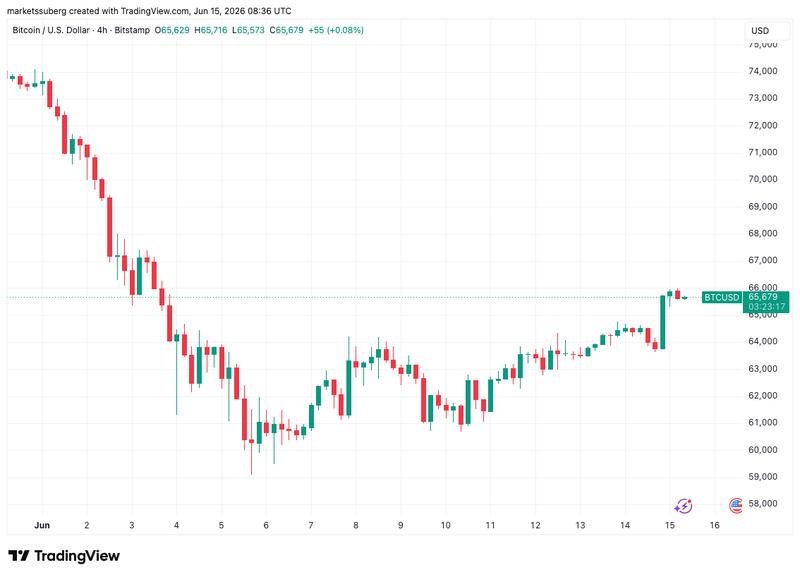
Reports of an Iran-US peace agreement catalyzed BTC price movement toward two-week peaks heading into Sunday's weekly candle closure.
TradingView data recorded local peak values of $65,988 as the fresh week commenced.
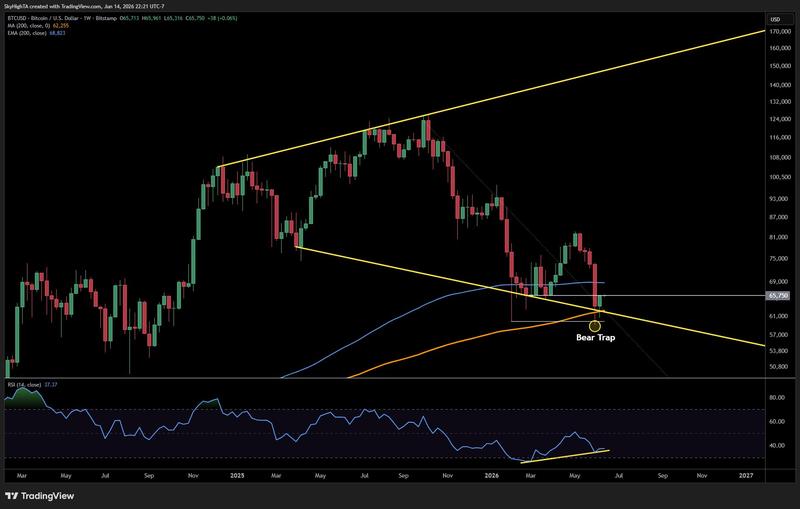
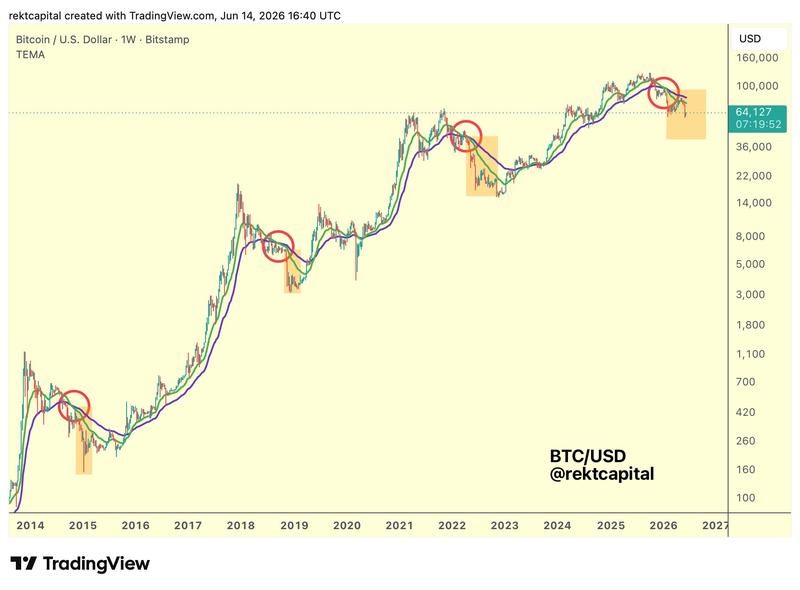
Having maintained both the $60,000 threshold and Bitcoin's 200-week simple moving average (SMA) at $62,000 as foundational support levels, market participants' near-term perspective started to brighten.
"Closed near the highs with almost no upper wick, favoring a push higher this week," trader SuperBro wrote in his latest analysis on X.
SuperBro identified the 200-week exponential moving average (EMA) as a plausible objective for short position liquidation.
"There are a lot of leveraged shorts up to the 200 EMA around $69K. Good chance that is where this is headed," he added.
"Q2 closes in just 2 weeks. Let's see if bulls can keep the heat on."
Trader CrypNuevo similarly targeted the zone immediately beneath the $70,000 level for the coming week.
"Still seeing a recovery to the mid-range $69k," he wrote in his X analysis.
CrypNuevo cautioned that BTC/USD might yet revisit recent lows as part of range-constrained price behavior.

Trader and analyst Rekt Capital concurred, emphasizing that price recoveries typically diminish in strength as bearish market conditions persist, together with critical support zones — specifically the $60,000 threshold.
Warsh faces scrutiny on rate decision amid political pressure
Despite significant geopolitical turbulence, market focus continues to center squarely on the US Federal Reserve.
This Wednesday, the Fed's newly appointed chair, Kevin Warsh, will preside over his inaugural policy meeting to determine interest-rate adjustments.
Considering the inflationary pressure generated by the Iran conflict, financial markets assign minimal probability to Warsh reducing rates — yet Trump has consistently advocated for precisely that outcome.
During an April interview, Trump informed mainstream media that he "would" be disappointed if Warsh failed to implement a reduction at the earliest opportunity.
"All eyes are on the Fed this week," trading resource The Kobeissi Letter summarized in its latest X analysis.
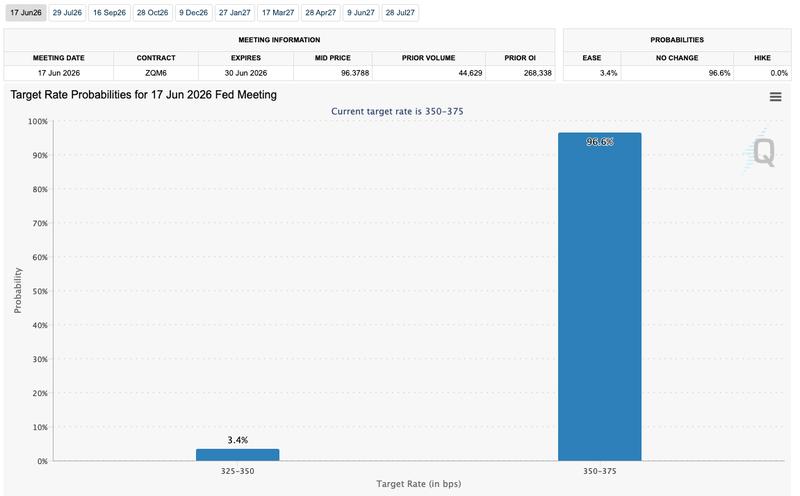
Current data from CME Group's FedWatch Tool indicates the probability of a modest 0.25% reduction stands at merely 3.4%.
In response, market observers overwhelmingly anticipate rates will remain unchanged from present levels.
In Sunday analysis, Dayan characterized Warsh as "trapped no matter what he does."
"If he is hawkish, he will be breaking promises made to Trump," he wrote.
"On the other hand, if he uses the recent decline in oil prices as a reason for a wait and see stance, I think he is raising the odds we will see a panic hike in the second half of the year as the economy overheats."
US financial markets will operate on a condensed four-day schedule this week, with Wall Street shuttered Friday observing the Juneteenth holiday.
Large holders establish "rock-solid floor" through accumulation
Providing encouragement for Bitcoin bulls, fresh analysis indicates a potential fundamental transformation in large-volume investor behavior during recent sessions.
Bitcoin whales, based on data from onchain analytics platform CryptoQuant, have transitioned back into accumulation mode.
Examining exchange deposits from whale wallet addresses, CryptoQuant metrics demonstrate that coin days destroyed (CDD) — representing the duration funds remained stationary following their previous movement — have substantially declined.
"Inflow CDD plunged from 2.16M to near-zero (33K), showing long-term whale dumping has completely stopped," contributor Woo Minkyu wrote in a Quicktake blog post on Monday.
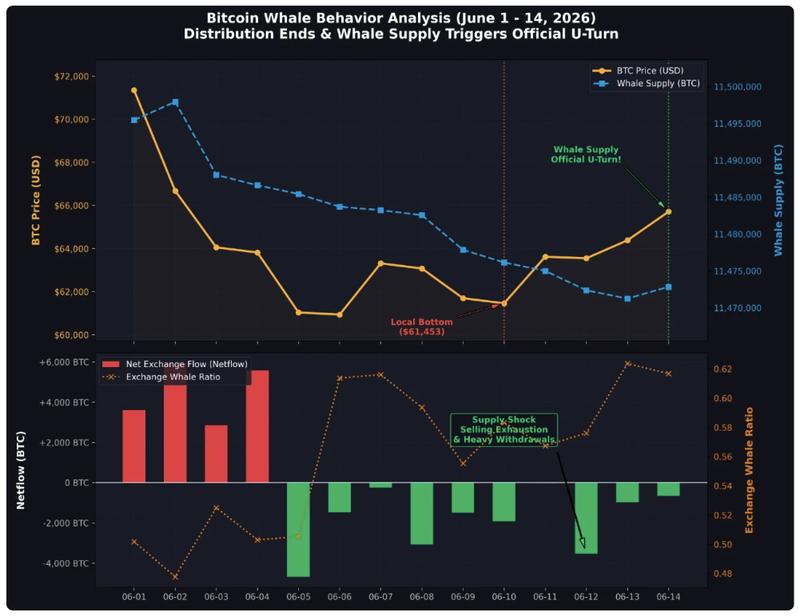
Woo characterized whales as executing an "aggressive bottom buy" around $61,000, absorbing "all" coins sold in panic by different investor categories.
"The wealth transfer from weak hands to strong hands is complete," he concluded.
"Whales have locked in the $60,000–$61,500 range as a rock-solid floor. With exchange reserves depleted, the path of least resistance for Bitcoin is now firmly upward."
Previously, Cointelegraph documented that three essential prerequisites for a BTC price recovery were approaching fulfillment. Whales operating on Hyperliquid and Bitfinex, analysis indicated at that juncture, had already established positions anticipating a rebound.
Apparent demand metrics remain in negative territory
Regarding a comprehensive bull-market recovery, CryptoQuant maintains a measured stance considering present onchain indicators.
Apparent demand, contributor XWIN Japan observes, continues registering negative values — a condition that has historically aligned with bearish market phases.
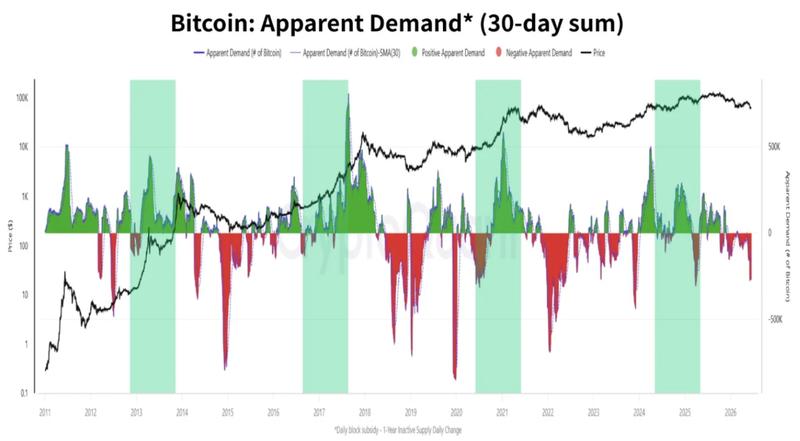
Apparent demand represents the differential between Bitcoin's issuance — meaning freshly mined coins — and the quantity of supply dormant for periods exceeding one year.
"If the decrease in inventory exceeds production, demand is increasing, and vice versa," CryptoQuant head of research Julio Moreno explains.
Consequently, existing negative readings indicate widespread absence of interest in BTC exposure and could potentially supersede the four-year cycle framework in determining subsequent price behavior, XWIN suggests.
"This suggests that Bitcoin may not be declining simply because 'the cycle says so.' Instead, demand growth has slowed," it wrote this weekend.
XWIN additionally highlighted diminishing open interest across Bitcoin futures exchanges while reinforcing the hypothesis that a conclusive "capitulation" occurrence might still materialize.