Analysts Forecast $40K as Bitcoin's Cycle Bottom Based on Multiple Price Models
Despite a temporary rally to $67,000, Bitcoin continues trading in bearish territory, with multiple on-chain indicators and price models pointing toward a potential floor around $40,000.

On Monday, Bitcoin (BTC) purchasers staged a modest recovery, driving the BTC price to an intraday peak of $67,860. Market analysts indicated that Bitcoin continues to trade within bearish conditions, with multiple indicators suggesting a possible floor beneath the $50,000 threshold.
Key takeaways:
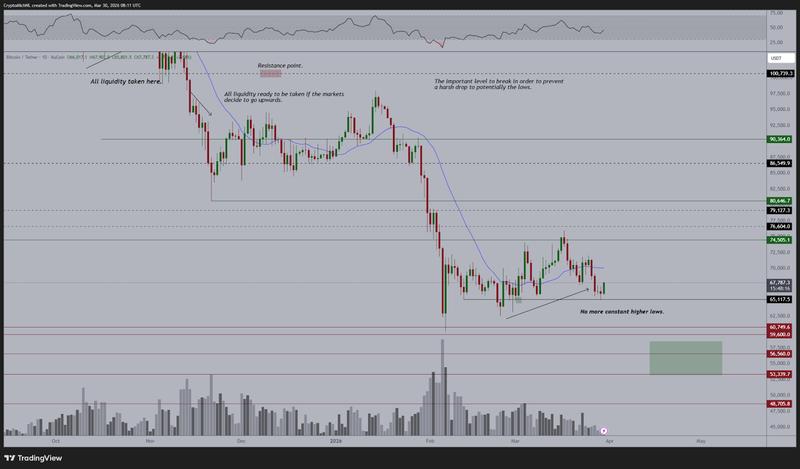
- The $70,000 level has transformed into a resistance point for Bitcoin price, opening the door for additional downside movement.
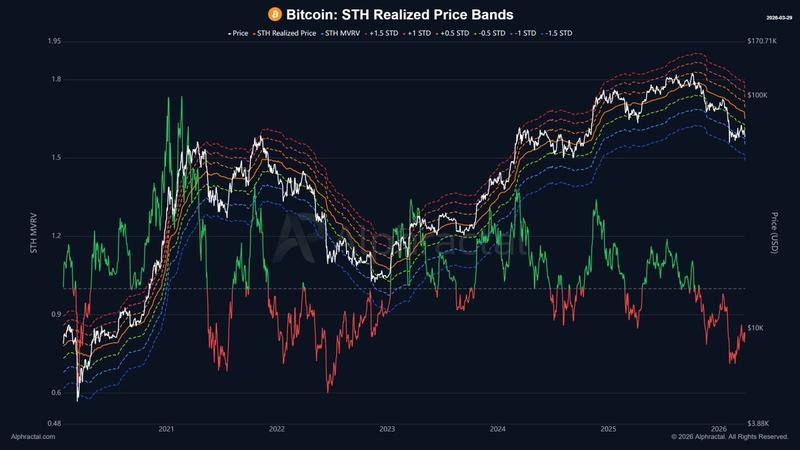
- The realized price bands for short-term Bitcoin holders have declined, indicating a possible bottom near $46,000.
- Analysis of historical retracement patterns and a bear flag formation suggest $39,000–$41,000 represents the cycle's ultimate low for BTC.
Downward momentum defines Bitcoin's easiest trajectory
According to TradingView data, BTC price continued its upward movement, gaining 1.5% throughout the day to reach $67,750, while the $69,000-$70,000 range established itself as fresh resistance territory.
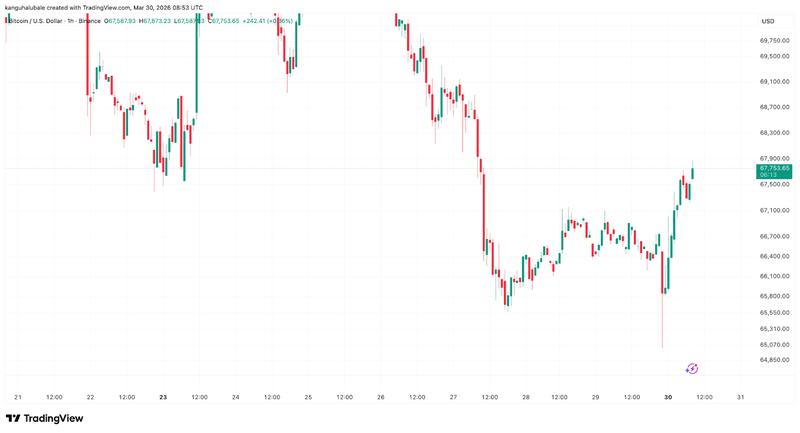
Examining Bitcoin's movement on shorter timeframes, the Telegram-based trading resource Technical Crypto Analyst noted that the failure to maintain $68,000-$69,000 support "confirms short-term bearish momentum," further stating:
"Unless price quickly reclaims $69K–$70K, the path of least resistance remains downward toward the $65K demand zone."
"Great bounce upwards, but nothing confirmed as of yet on Bitcoin," stated Michael van de Poppe, founder of MN Capital, in a Monday X platform post.
He noted that it "all depends on macroeconomic events; however, I'd rather see a breakout above $71K for confirmation," before adding:
"On the other hand, a classic little sweep to $65K just before the push upwards would signal that we're going to get that momentum."
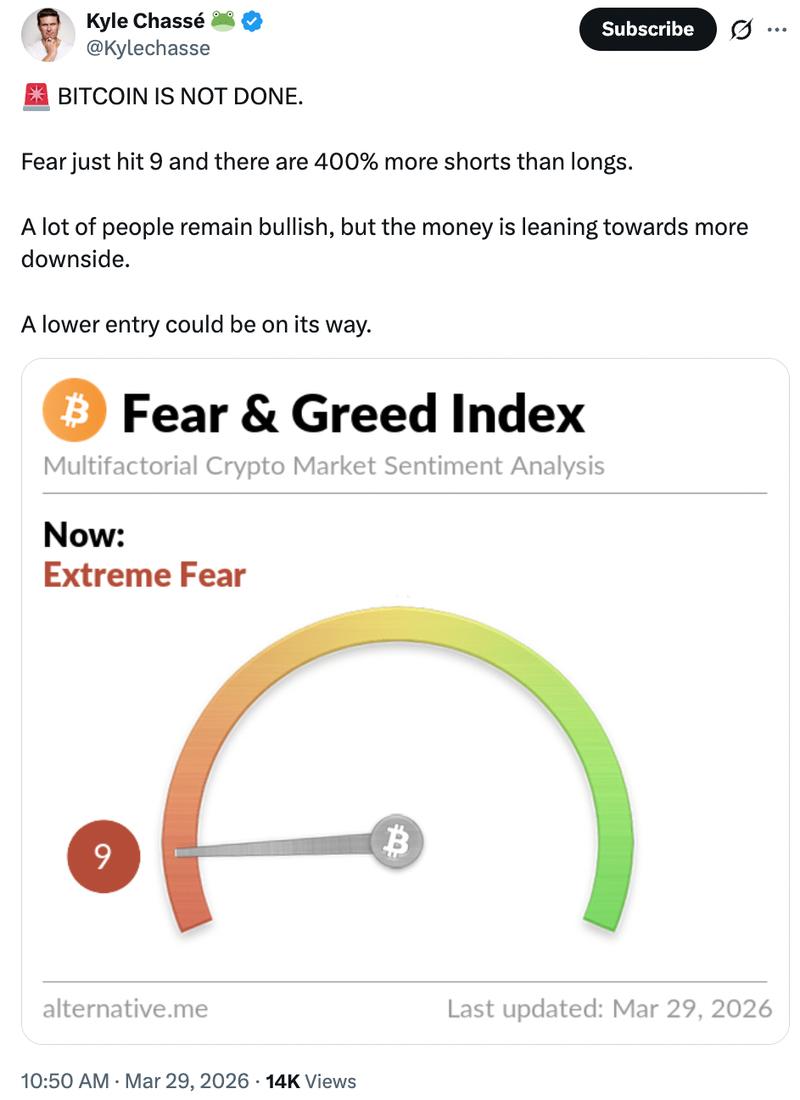
Market analyst Kyle Chassé observed that with the Fear and Greed index remaining within the "extreme fear zone" and order book data revealing more short positions than long positions, market conditions lean "towards more downside."
What price level will mark Bitcoin's bottom?
The 46% decline in Bitcoin from its record high of $126,000 has resulted in the cost basis for short-term holders (STH) — representing the average acquisition price for entities holding BTC for fewer than 155 days — falling from $113,500 down to $83,200.
"This is a sign that the pricing for a potential bottom has also moved lower," explained Joao Wedson, CEO and founder at Alphractal, in a Monday post on X.
Additionally, the lower boundary of the STH realized pricing bands (blue line) has shifted "even lower, which could confirm that Bitcoin may form a bottom around $50K or slightly below," Wedson continued.
Historical data illustrated in the chart below demonstrates that Bitcoin reached its lowest point just beneath the lower band of the STH realized price throughout the 2022 bear market cycle.
Market analyst Willy Woo suggested that Bitcoin's bear market floor could fall somewhere between its realized price, presently at $54,000, and the Cumulative Value-Days Destroyed (CVDD), which currently stands at $45,500.
"Old school onchain models suggest a BTC bottom between $46K-54K."
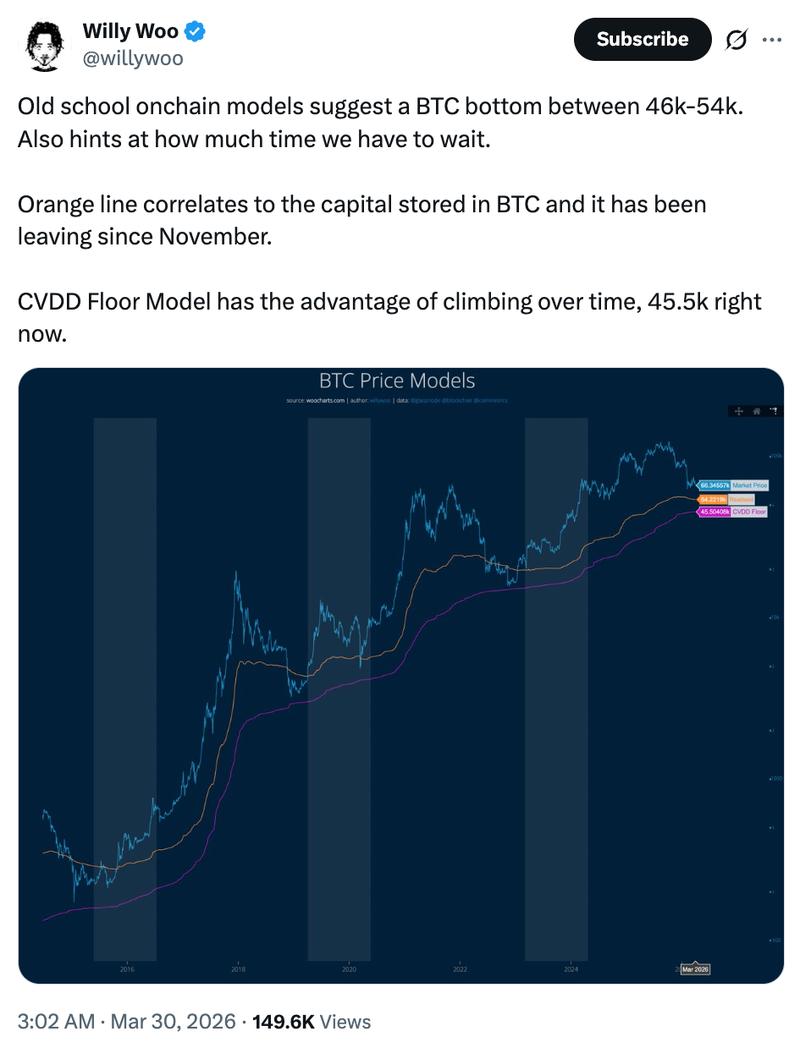
The CVDD indicator calculates the cumulative value of "Coin Days Destroyed" (representing long-term holder distribution activity) in relation to the market's total age, establishing an ascending "floor" price level throughout bearish market periods.
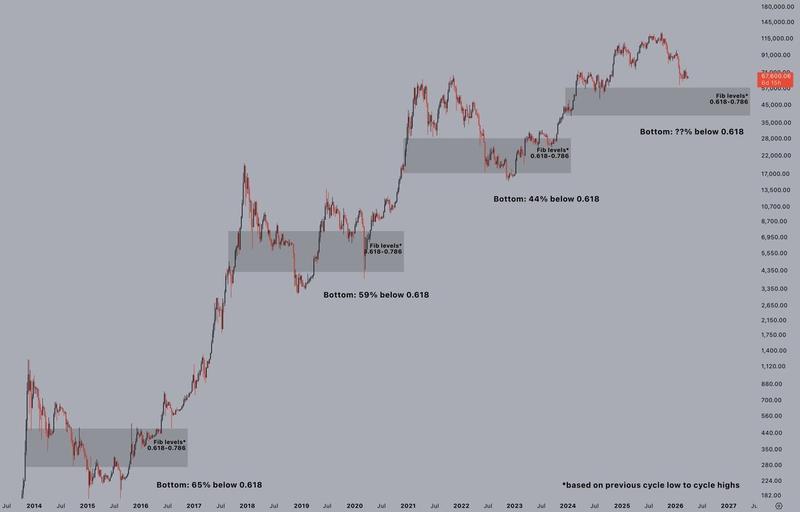
Cryptocurrency analyst Crypto Jelle noted that Bitcoin's previous bear market bottoms have consistently materialized between the 0.618 and the 0.786 Fibonacci retracement levels, currently positioned at $57,600 and $39,000, respectively.
According to previous Cointelegraph coverage, the ongoing "last stages" of the bear market cycle are generating forecasts as low as $41,000, derived from technical analysis of a bear flag pattern breakdown.