Analyst Cautions: Ethereum Could Plunge to $1.2K Level
A recognizable bull trap pattern is appearing in Ethereum's price action, similar to previous formations that triggered 45% and 48% declines, indicating potential for another significant downturn.

According to analyst Leshka.eth, Ether (ETH), the native cryptocurrency of the Ethereum network, faces the possibility of a 40% decline toward the $1,200 level in the upcoming weeks, based on a fractal pattern analysis.
Key takeaways:
- A historical pattern similar to those that resulted in 45% and 48% price drops is currently being mirrored by Ethereum.
- The short-term price outlook is being undermined by macroeconomic uncertainties and whale selling activity.
Bull trap signal emerges in Ethereum's technical setup
The projected $1,200 downside level for Ethereum derives from a Supertrend indicator setup visible on the daily timeframe chart, where two previous instances of bullish trend reversals ultimately failed and resulted in substantial price corrections.
The Supertrend indicator functions as a straightforward trend-tracking line that appears directly on price charts. Its color transitions indicate the prevailing market direction: displaying green during uptrends and switching to red during downtrends.
Similar bullish trend reversals appeared in ETH's price action during October 2025 and January 2026, though both ultimately proved unsuccessful.
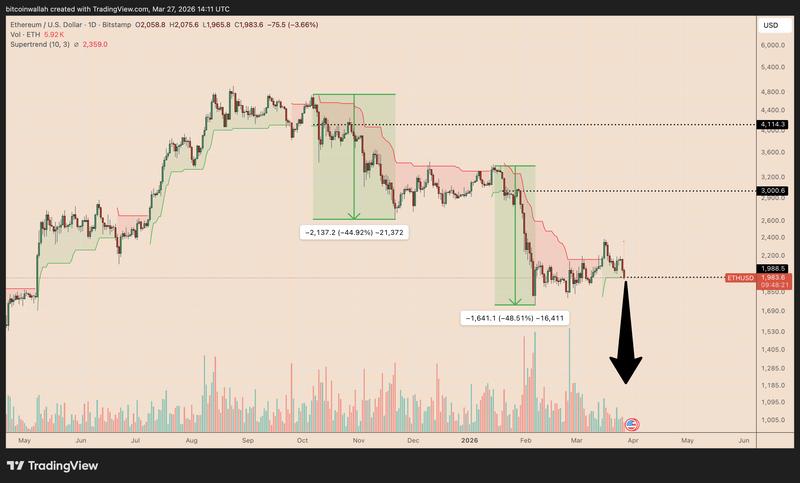
During both previous occurrences, ETH's price climbed above the Supertrend indicator's upper boundary, which subsequently functioned as a support level. Following ETH's failure to maintain that support, the rally reversed course and the asset experienced declines of 45% and 48% in each respective instance.
Leshka.eth noted that "Now the same setup is forming at $1,990," further explaining:
"If that level breaks, the next target is the $1,200 zone."
This projection corresponds with the calculated downside objective derived from Ethereum's current bear flag technical pattern, illustrated in the chart below.
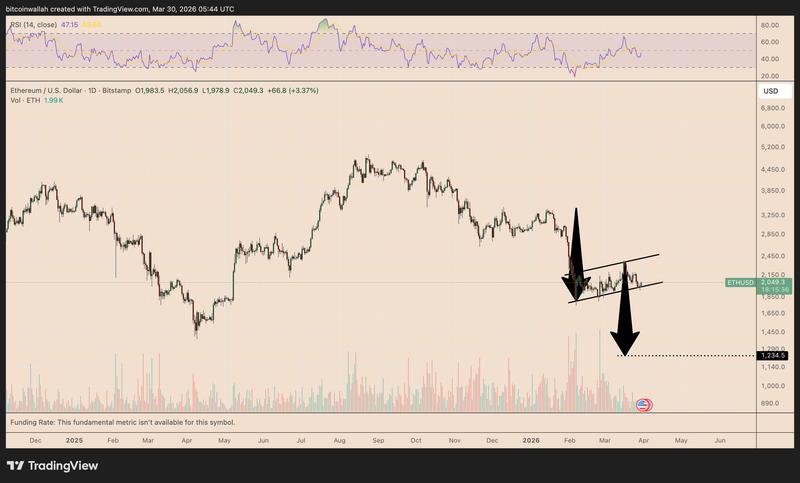
These bearish technical formations are developing as Ethereum relinquishes its March price gains amid a deteriorating macroeconomic environment.
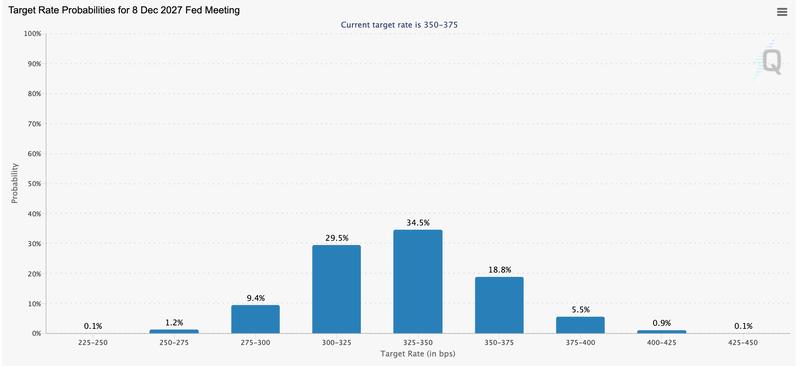
Market risk appetite has diminished in light of the ongoing US–Israel and Iran conflict, concerns about economic recession have intensified, and bond market participants no longer anticipate Federal Reserve interest rate reductions before December 2027.
ETH's value has declined by more than 17% from the monthly peak it reached over two weeks earlier. During this identical period, US spot Ether exchange-traded funds have experienced approximately $300 million in net capital withdrawals.
The observable market demand for Ethereum has additionally dropped to levels not seen in 16 months.
Accumulation activity among ETH holders shows weakness
Data from Glassnode reveals that Ethereum's recent price recovery has failed to stimulate widespread accumulation behavior across significant wallet holder categories.
Specifically, the quantity of mega-whale wallets containing more than 10,000 ETH has leveled off following a peak in late 2025, while the 30-day rate of change has only recently begun inching back toward neutral territory after experiencing months of negative movement.
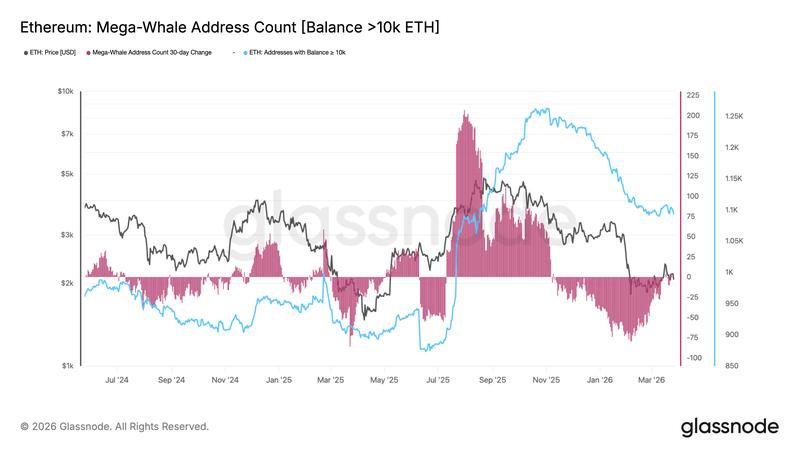
This indicates that the largest cryptocurrency holders have refrained from engaging in aggressive accumulation strategies.
A comparable situation is evident among wallet categories containing smaller holdings.
Whale addresses holding between 1,000 and 10,000 ETH continue trading below their late-2025 peak levels, with the 30-day change metric fluctuating around neutral or marginally negative territory.
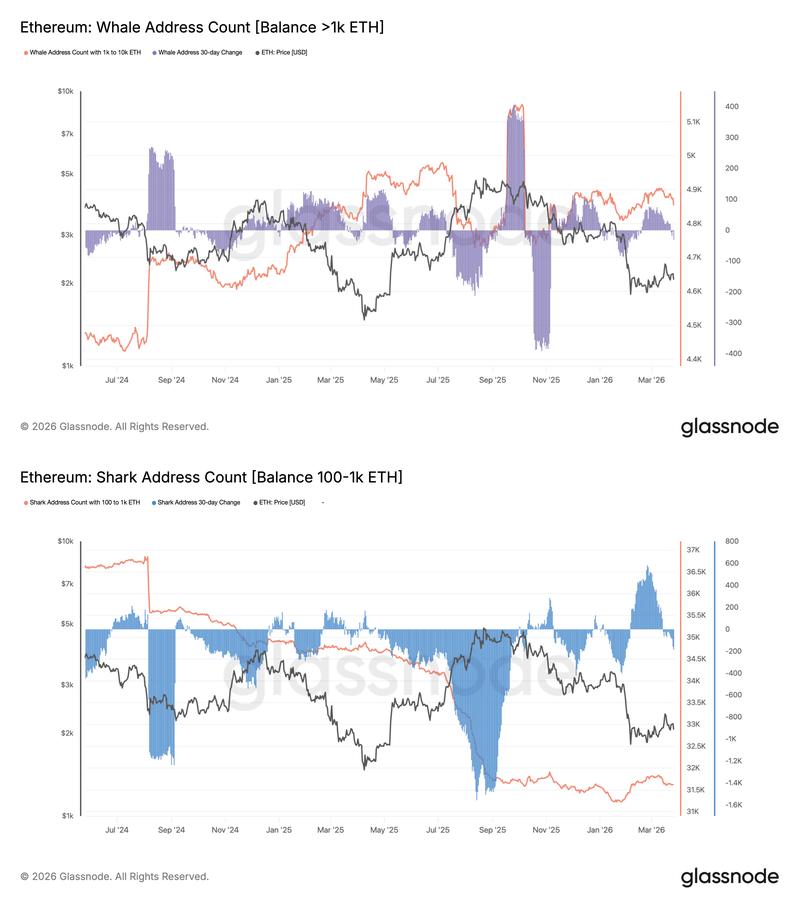
Shark-tier wallets containing between 100 and 1,000 ETH are also maintaining positions significantly below the previous year's peak levels, indicating that both mid-tier and smaller large-scale holders have not reemerged as substantial buyers in the market.
Collectively, this information points to continued distribution patterns and insufficient conviction among critical ETH holder segments, strengthening the possibility of a more significant decline should the $1,990 support level fail to hold.
According to previous reporting by Cointelegraph, among the limited bullish indicators for Ethereum are the growing volume of Ether being staked and the reduction of supply held on exchanges to decade-low levels.