Glassnode Reports: Bitcoin Metrics Show Longest Downturn Period Since FTX Collapse
Glassnode's tracking of 45 distinct Bitcoin price indicators reveals they are experiencing their most extended combined capitulation period since the FTX exchange failure and the conclusion of 2022's bearish market conditions.
According to a Monday report from onchain analytics platform Glassnode, Bitcoin (BTC) is experiencing its most prolonged capitulation period since the conclusion of the 2022 bearish market cycle.
Key points:
- Glassnode's surveillance of 45 Bitcoin price indicators shows they remain in their most extended "capitulation" stretch since FTX's collapse during late 2022.
- According to creator Rafael Schultze-Kraft, combined measurements must still decline further to reach levels that have historically indicated previous bear-market lows.
45 Bitcoin price metrics spend 2026 in "capitulation" zone
Throughout 2026, Glassnode's Bitcoin Cycle Position Heatmap, an aggregated BTC price metric visualization instrument, has been displaying capitulation signals.
Developed by Rafael Schultze-Kraft, the platform's co-founder, this instrument aggregates information from 45 distinct indicators to deliver a comprehensive view of market conditions as Bitcoin price cycles continue their recurring patterns. When the heatmap displays predominantly blue coloring, it signals a "capitulation" period within the cycle, whereas red coloring identifies the euphoric sentiment typical of upward momentum heading toward cycle highs.
Following a euphoric period during November 2021, the heatmap transitioned to predominantly blue throughout most of 2022. During November of that year, the FTX cryptocurrency exchange experienced its catastrophic failure, an occurrence that aligned with Bitcoin reaching its previous bear-market low point at $15,600.
Today it sits in its coldest stretch since FTX: late in the bear, but not yet the unanimous deep blue that previously marked a floor.
Rafael Schultze-Kraft
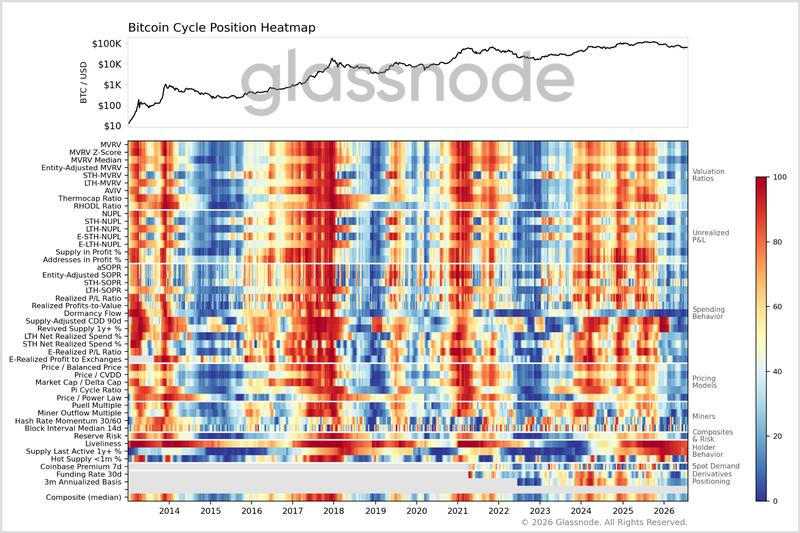
Beyond fundamental price measurements like market capitalization, the heatmap places substantial emphasis on analyzing the profitability levels of Bitcoin's investor community, categorizing them into short-term holders (STH) and long-term holders (LTH).
Schultze-Kraft observes that specific metrics demonstrate evolving behavior patterns across time, necessitating more sophisticated interpretation when utilizing them for cycle indication purposes. Dormancy represents one such metric — measuring how many days a BTC unit has remained inactive before being used in an onchain transaction. In this case, the maturing investor community means dormancy values rise progressively over time, creating variations across different cycles.
Coldcard hack spikes sub-1 BTC transactions
Glassnode's most recent Market Pulse report, published on Monday, praised the endurance demonstrated by market participants.
On-chain activity strengthened materially. Daily active addresses and entity-adjusted transfer volumes moved above their upper statistical bands, indicating a notable increase in network engagement and economic throughput.
Capital outflow patterns remained stable despite an immediate reactive response from certain investors following the discovery of the low-entropy bug vulnerability affecting Coldcard hardware wallets.
Information from analytics platform CryptoQuant drew parallels between the surge in onchain transactions involving 1 BTC or less and the period following FTX's collapse. On July 31, daily transaction volumes hit 39,600 BTC, a figure closely matching the 39,900 BTC recorded on Nov. 16, 2022.