ETH Could Plunge Under $2,000 as Traditional Technical Formation Takes Shape
February could see Ether drop to the $1,665-$1,725 territory as multiple bearish on-chain and technical signals align.

Ether (ETH), the native cryptocurrency of the Ethereum network, faces the possibility of dropping beneath the $2,000 threshold during February as a traditional bearish chart formation continues to unfold.
Key takeaways:
- ETH breakdown keeps $1,665 downside target in focus.
- MVRV bands also point to price sliding toward $1,725 or lower before a potential bottom.
ETH risks declining 25% in February
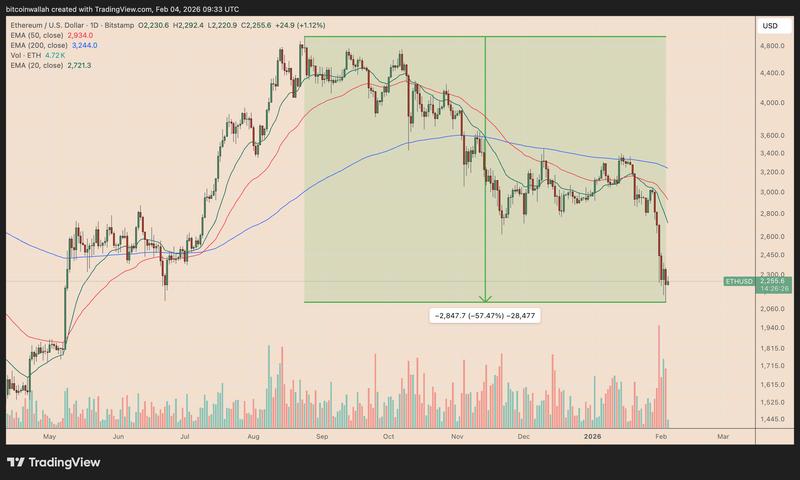
By Wednesday's trading session, ETH had moved into the breakdown phase of its current inverse-cup-and-handle (IC&H) formation. This development could further extend a downward trend that has already wiped out approximately 60% of value from its August 2025 high point.
The IC&H formation develops when the price creates a rounded peak followed by a drift upward within a small recovery corridor. The pattern typically completes itself when the price breaks beneath the neckline support level, frequently dropping by an amount equivalent to the maximum height of the cup.
During January, Ether breached the inverse cup-and-handle neckline positioned near $2,960. The cryptocurrency subsequently rallied to retest that price level as resistance, which represents a typical post-breakdown behavior, before continuing its descent.
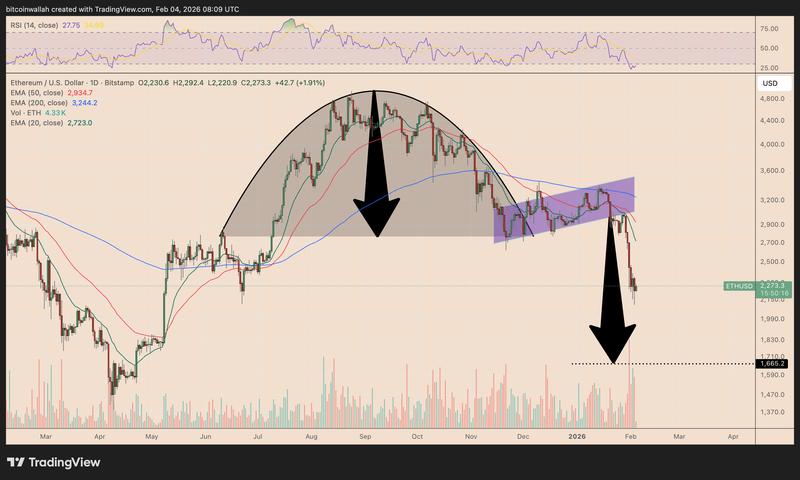
The rebound in ETH also encountered resistance below the 20-day (green) and 50-day (red) EMAs, both of which served as overhead barriers.
This confluence of technical indicators increased the probability of ETH dropping toward the IC&H breakdown objective positioned around $1,665, representing a 25% decline, in February or by early March.
Based on historical performance, the inverse cup-and-handle achieves its projected downside objective with an 82% success rate, according to a study by Chartswatcher.
Looking at the broader picture, Ethereum's downside exposure is growing as market participants reduce their crypto positions, concerned the market might enter into a wider 2026 downturn comparable to previous "four-year cycle" corrections.
Concerns surrounding a potential "AI bubble" bursting are also compelling traders to steer clear of higher-risk investments such as crypto.
Ethereum's MVRV bands hint at $1,725 target
The technical downside objective for Ethereum positioned itself just beneath the bottom boundary of its MVRV extreme deviation pricing bands, presently located at $1,725.
These pricing bands represent onchain price territories that indicate when ETH is exchanging below or above the mean price at which market participants last transferred their holdings.
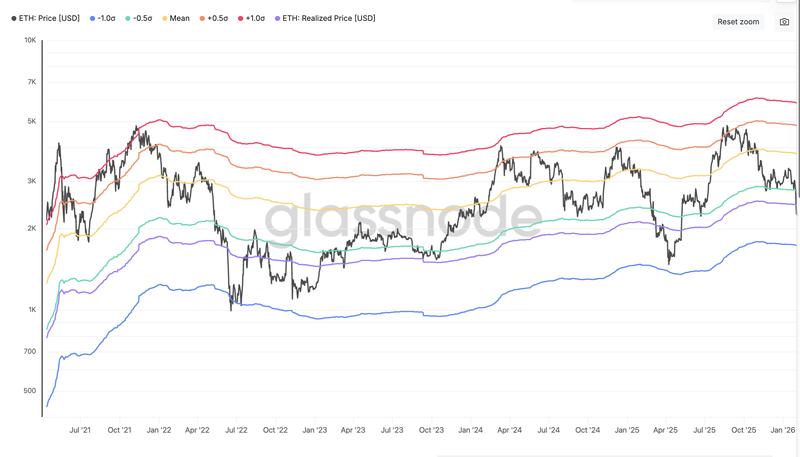
Looking at historical patterns, ETH price has dropped near or even beneath the lowest MVRV band prior to establishing a bottom.
This includes the April 2025 recovery, when the ETH price surged 90% within a month following a test of the lowest MVRV deviation band around $1,390. A comparable rebound took place in June 2018.
Consequently, Ether may slide toward $1,725 or lower in February, which aligns with the IC&H downside objective.