BTC targets $90K milestone as major holders accumulate 20x daily production over month
The leading cryptocurrency has begun breaking out from a textbook bullish reversal formation, setting its sights on a potential climb to $90,000.

The world's largest cryptocurrency, Bitcoin (BTC), looks poised to reach the $90,000 threshold in the weeks ahead as large-scale holders acquired approximately 20 times the digital asset's daily new issuance over recent weeks.
Key takeaways:
- Large holders purchased approximately 270,000 BTC over the last 30 days.
- The cryptocurrency escaped from its symmetrical pattern formation with a calculated objective around $92,220.
Major BTC holders accumulate at record rate since 2013
Large holders, defined as entities controlling more than 1,000 BTC, have incorporated approximately 270,000 coins into their holdings over the last 30 days, representing their most significant accumulation phase since 2013, based on blockchain analytics platform CryptoQuant.
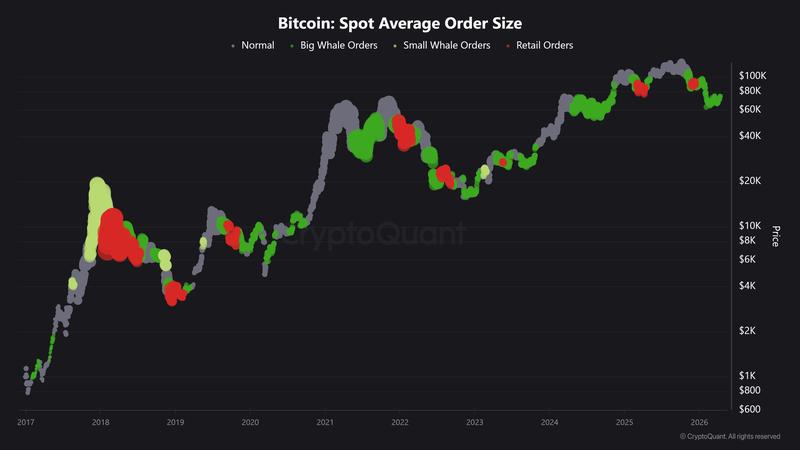
A portion of this large-scale accumulation activity probably originated from Strategy. The corporation's latest regulatory submissions reveal that it acquired approximately 42,166 BTC during the March through April timeframe, representing roughly 16% of the total 270,000 BTC incorporated by whale addresses throughout the identical period.
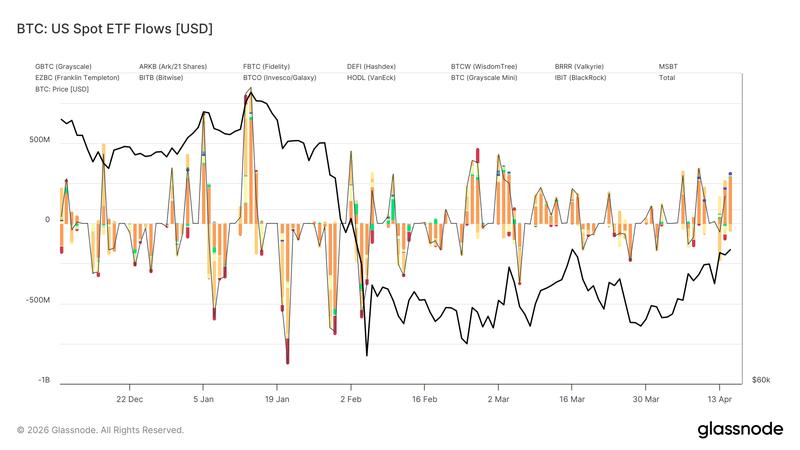
Bitcoin exchange-traded funds operating in the United States also registered over $200 million in net capital inflows throughout this timeframe. However, these inflows continue to appear relatively conservative when measured against previous stages of the market cycle, suggesting measured re-entry by institutional participants on Wall Street.
This accumulation activity occurred despite Bitcoin experiencing significant volatility in recent trading sessions, including an approximately 15% decline before completely recouping those losses, with diminishing tensions between the US and Iran contributing to the restoration of risk appetite among investors.
Triangle formation on BTC charts suggests rally toward $90,000
Examining the technical landscape, Bitcoin has now reached the breakout phase of its ongoing symmetrical triangle chart pattern.
These triangle formations have the potential to resolve in either direction independent of the dominant trend, with the subsequent price movement frequently corresponding to the pattern's maximum vertical height.
Looking at Bitcoin's specific situation, the asset has broken upward following a decisive move above the triangle's resistance trendline, creating conditions for a possible advance toward the calculated objective near $92,220 during April or May.
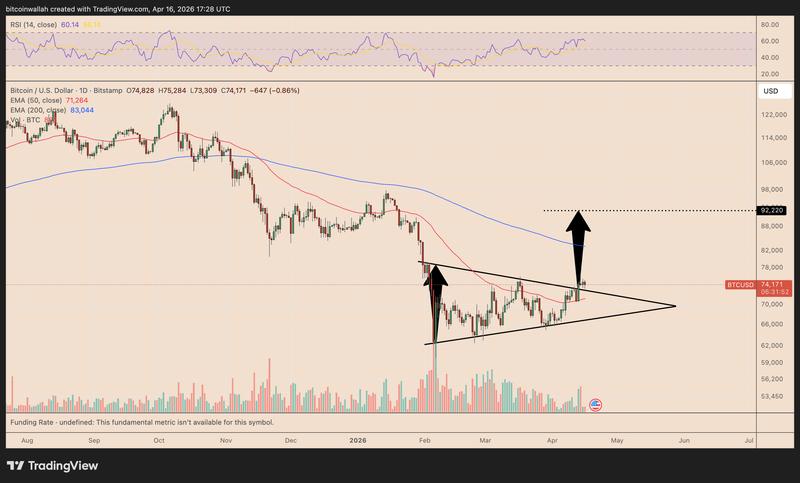
The cryptocurrency must successfully penetrate above its 200-day exponential moving average (200-day EMA, the blue line) positioned around $83,000 to achieve the triangle's projected target. This particular EMA previously played a crucial role in restricting BTC's efforts at an upward breakout during January.
Previously, Nic Puckrin, crypto analyst and founder of Coin Bureau, said Bitcoin could push toward $90,000 if the current US–Iran ceasefire holds, oil prices fall toward $80, and softer economic data helps ease stagflation fears.
This article is produced in accordance with Cointelegraph's Editorial Policy and is intended for informational purposes only. It does not constitute investment advice or recommendations. All investments and trades carry risk; readers are encouraged to conduct independent research before making any decisions. Cointelegraph makes no guarantees regarding the accuracy or completeness of the information presented, including forward-looking statements, and will not be liable for any loss or damage arising from reliance on this content.