BTC Plunges to $76K Following Trump's Warning That Iran's Time Is Running Out
The leading cryptocurrency tumbled to its lowest level in three weeks, hovering around $76,000, as tensions between the United States and Iran intensified, leading to $607 million in cryptocurrency liquidations.

During the early hours of Asian market activity on Monday, Bitcoin (BTC) experienced a decline to the $76,000 level as geopolitical friction between the US and Iran reemerged.
Key takeaways
- The price of Bitcoin descends to $76,500 as downward pressure becomes more closely linked to international political events.
- Liquidations exceeding $607 million in long positions have occurred within the past 24 hours.
- Market analysts specializing in Bitcoin suggest that maintaining the $76,000 support level is crucial to prevent a potential decline to $65,000.
Bitcoin reaches three-week low point with 7% decline
Information obtained from TradingView revealed that the BTC price experienced a decline of up to 7% during the previous three days, falling to three-week minimum levels of $76,500 and wiping out all positive movement that had accumulated since the beginning of May.
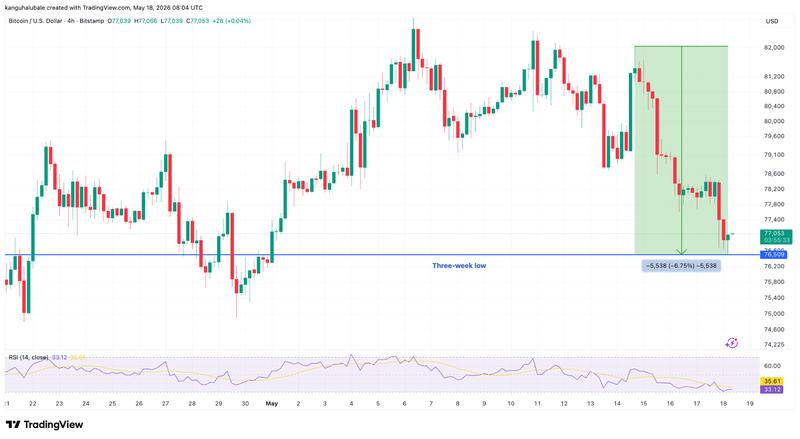
These losses occurred mere days following BTC/USD's climb to 13-week peak levels near $83,000, which had been driven by substantial capital inflows into spot exchange-traded funds and positive sentiment surrounding the United States CLARITY Act.
However, on Sunday, Donald Trump, the President of the United States, delivered new warnings directed at Iran concerning postponements in reaching a peace agreement, cautioning that time was running out.

"Trump confirms the clock is ticking for Iran. The US is allegedly preparing for a potential new military operation against Iran," analyst CryptoRover said in a Monday post on X, adding:
"This is extremely dangerous for $BTC."
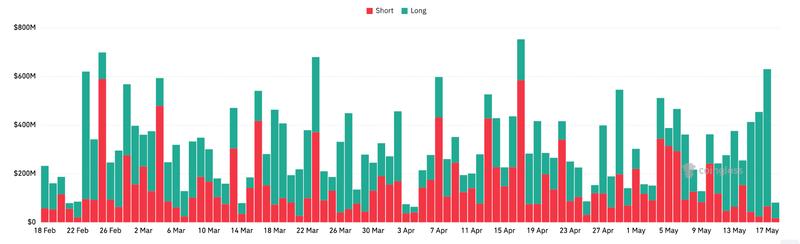
Bitcoin's downward movement was accompanied by $607 million worth of liquidations in long positions during the past 24 hours, with liquidations specific to BTC long positions representing $190 million of that total.
This elevated the aggregate liquidations throughout the cryptocurrency market during the last 24 hours to a total of $677 million.
The oil market also experienced price volatility, with WTI climbing more than 3% within just hours to reach $104 per barrel before pulling back to the $101 level.
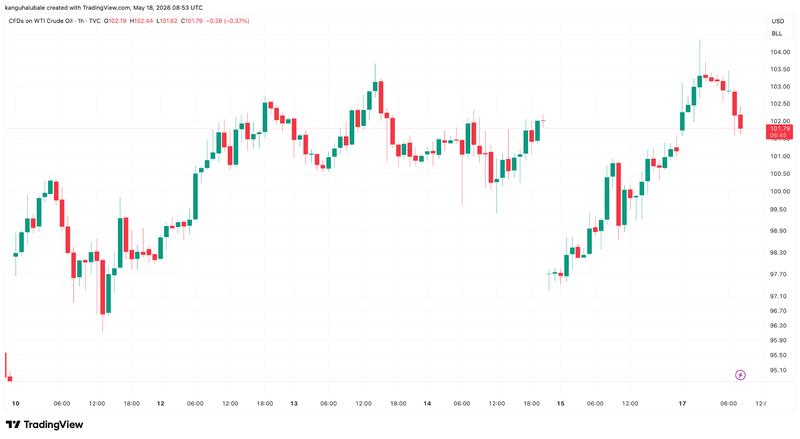
"WTI surged above $103 as Trump publicly lost patience with stalled peace talks and a waiver for Russian crude sales expired, adding to supply fears around the still-disrupted Strait of Hormuz," trading resource Capital.com said in a Monday X post, adding:
"Higher oil means hotter future inflation, reinforcing higher-for-longer Fed expectations and lifting both the dollar and yields — a tough combination."
Market analysts suggest bears have regained control
In the meantime, those trading Bitcoin examined the technical configuration for indicators about the potential direction of the next price movement.
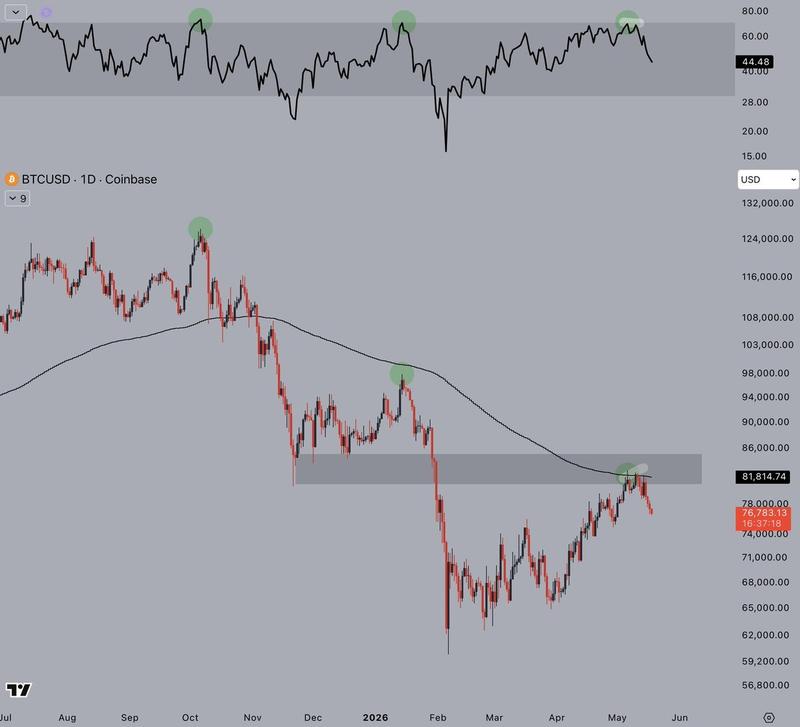
Analyst CryptoJelleNL said that a bearish divergence from the relative index as BTC/USD ran into resistance at $82,000 was responsible for the "pullback we're in right now," adding:
"Bears getting back in the driver's seat?"
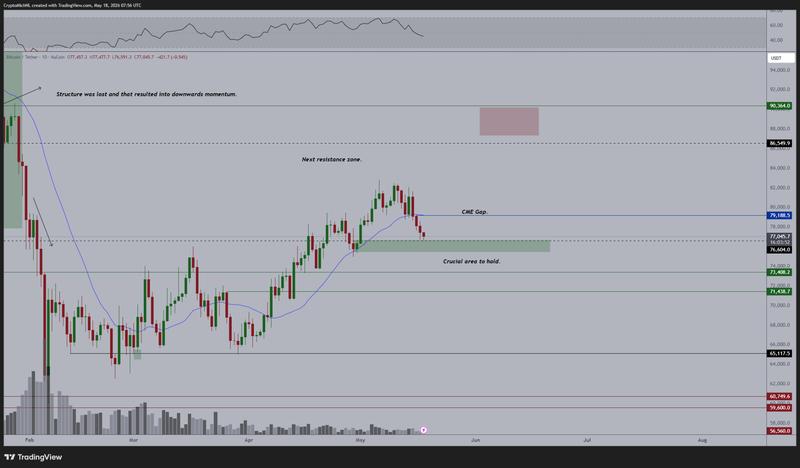
According to Michael van de Poppe, founder of MN Capital, the immediate support level at $76,000 must be maintained to "prevent a market-wide crash."
A chart that accompanied his analysis identified additional support zones to monitor should this critical area fail to hold, including a demand zone ranging from $71,000 to $73,000 and a local bottom situated at $65,000.
The local bottom at the $65,000 level aligns with the projected target of an inverted V-shaped formation, as illustrated on the daily chart presented below. This pattern indicates a potential 16% decrease from current price levels.
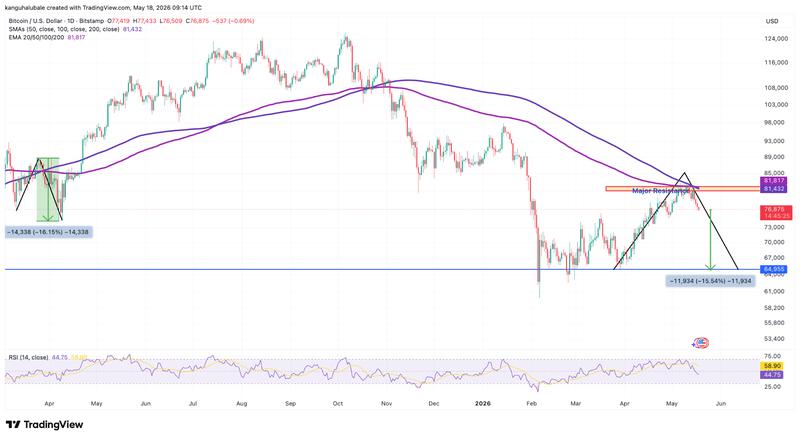
It should be noted that the BTC/USD trading pair underwent a similarly sharp price correction of identical magnitude following its rejection at the 200-day moving averages during April 2025.