BTC Liquidity Imbalance Points to Potential Surge Toward $80,000 Mark
Market indicators reveal Bitcoin derivatives traders are accumulating short positions at higher levels, increasing the likelihood of a price advance to $80,000.

Bitcoin (BTC) is experiencing a significant liquidity imbalance forming around the $80,000 price level, where over $4 billion worth of short positions remain exposed to potential liquidation above that threshold. This configuration has gained momentum following Bitcoin's successful defense of the $76,100 support zone across two consecutive days, accompanied by the emergence of bullish technical patterns across shorter timeframes.
Short position liquidations accumulate beyond $80,000
When examining the one-hour timeframe, Bitcoin has developed a bullish divergence pattern comparing the price movement against the relative strength index (RSI), displaying enhanced momentum alongside progressively higher lows around the $76,100 mark, which points to strengthening buying pressure underneath. Additionally, BTC managed to retest the $78,000 threshold on Thursday following its successful protection of the $76,100 support zone on numerous occasions throughout the current week.
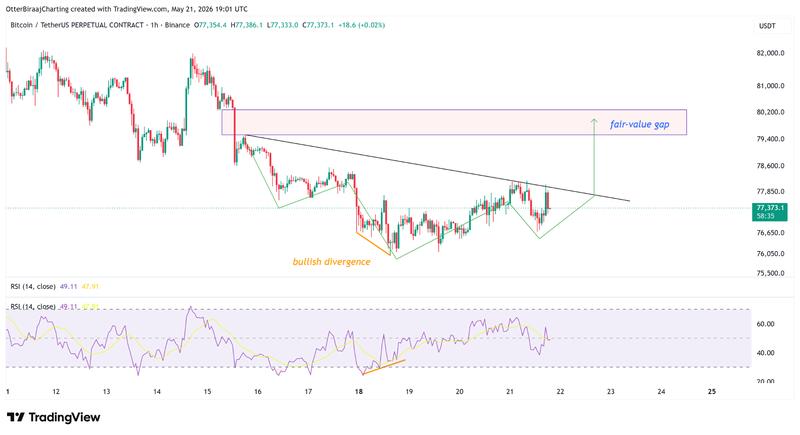
The current price movement is additionally forming an inverse head-and-shoulders pattern underneath a downward-sloping trendline, a formation that frequently indicates diminishing bearish momentum preceding an upward breakthrough. A successful advance beyond $78,000 has the potential to reveal the fair-value gap (FVG) spanning from $79,500 through $80,300, representing a thin-liquidity price area generated during a previous rapid decline that BTC price might return to in order to complete the untapped trading range prior to establishing its subsequent directional move.
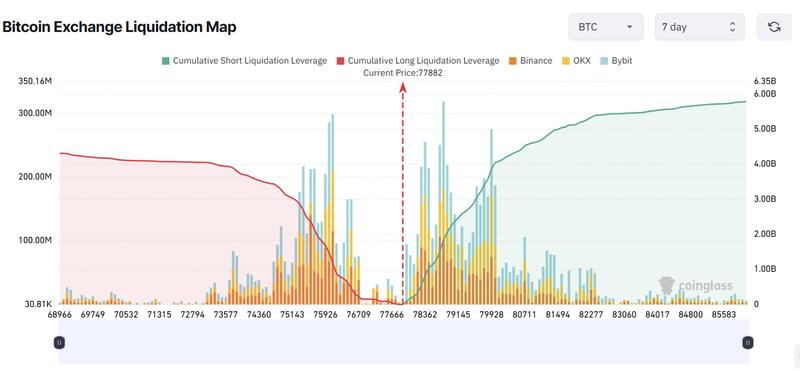
According to liquidation metrics from CoinGlass, the most substantial cluster of leveraged exposure exists above the current trading levels. An advance in the direction of $80,000 would place over $4 billion in accumulated short positions at risk. In contrast, a downward move approaching $75,000 would threaten approximately $3 billion worth of long position liquidations.
This pattern reveals that traders holding short positions encounter higher vulnerability compared to those maintaining bullish positions should BTC sustain its upward trajectory.
Futures market activity dominates spot trading
Liquidation events involving BTC have already intensified throughout the previous 24-hour period. Information from CoinGlass documented 103,963 traders experiencing liquidations, with aggregate liquidation values climbing to $286.08 million. Short position eliminations represented approximately $175 million of the overall figure, whereas the single largest liquidation event occurred on Binance's BTCUSDT trading pair, reaching $3.04 million.
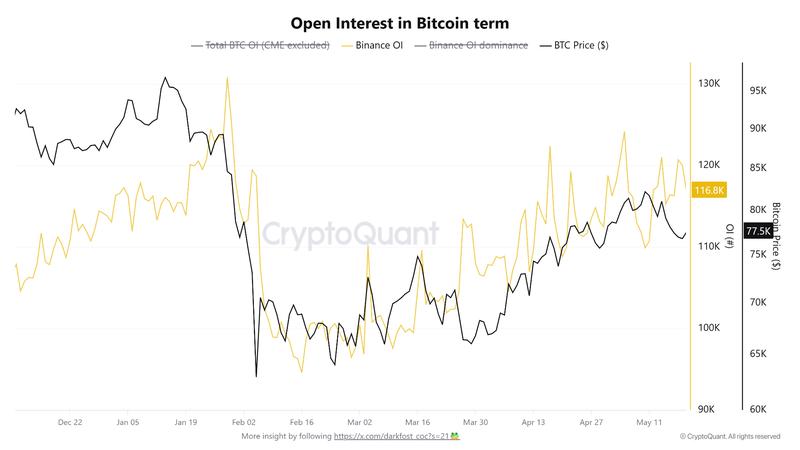
Information provided by CryptoQuant revealed Bitcoin-denominated open interest hovering around 116,800 BTC, representing a decline from the previous day's level of 120,000 BTC. This reduced open interest suggests that market participants eliminated portions of their leveraged positions throughout the recent period of heightened volatility. Such behavior typically reflects more measured derivatives market activity as opposed to excessive speculative fervor.
Spot market engagement remained subdued throughout Bitcoin's price recovery movement toward $78,000. The combined spot cumulative volume delta (CVD), which measures the net differential between buying and selling activity, registered at -$483 million. Meanwhile, the futures CVD shifted to marginally positive territory at approximately $34 million, as funding rates maintained elevated levels, signaling a bullish inclination over the near term.
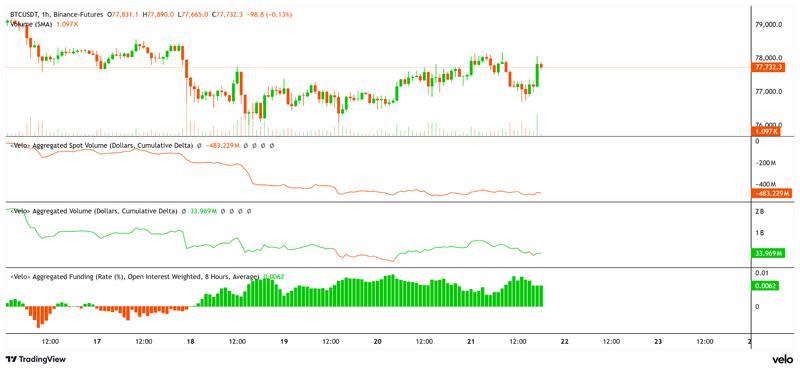
The divergence between insufficient spot market demand and comparatively robust futures market performance demonstrates that traders utilizing leverage are responsible for propelling the recent price appreciation. The liquidity buildup positioned above $80,000 currently represents the most transparent near-term price target for potential retesting.